


- Cardano’s descending trend line intersects with 50-period MA, suggesting a potential momentum shift.
- Price consolidation near critical resistance levels, indicating possible bullish movement in upcoming sessions.
- Recent candlestick volatility shows market indecision, potentially setting the stage for decisive price action.
Cardano has experienced notable trading volatility recently, with its price action drawing attention. At the time of writing, the trading chart reveals a significant trend as the price hovers at $0.4 levels. A descending red trend line marks the resistance, while support is increasingly evident near $0.440 and $0.460. Such levels are crucial for traders monitoring ADA’s potential for a breakout.
A crypto analyst, Dan Gambardello, showed a chart showing the 50-period moving average (MA) in blue, intersecting beneath the descending trend line. This intersection might hint at a momentum shift, often watched by savvy investors. Meanwhile, a shorter-period MA in green provides immediate resistance, suggesting that ADA is in a consolidation phase, prepping for a potential uptrend.

The candlestick patterns illustrate increased market indecision, evidenced by pronounced wicks on both ends of the candles. This volatility indicates that traders are split, with no clear dominance in buying or selling pressure at these levels.
However, the positioning above the blue MA and below the critical descending line hints that Cardano could be on the cusp of a significant price movement.
Cardano price has seen a significant drop today, plunging by 13.01% to a current value of $0.3407. This downturn is part of a broader trend visible on the cryptocurrency’s price chart, which shows a consistent decline over the past year. The market capitalization of Cardano now stands at approximately $12.08 billion, marking a decrease of 13.79%, which mirrors the drop in its price.
Cardano and Ethereum Bullish Breakouts Signal Major GainsAdditionally, trading volumes for Cardano have increased by 29.70% over the past 24 hours, totaling around $744 million. This suggests that while the price is falling, trading activity is higher, indicating increased selling pressure.
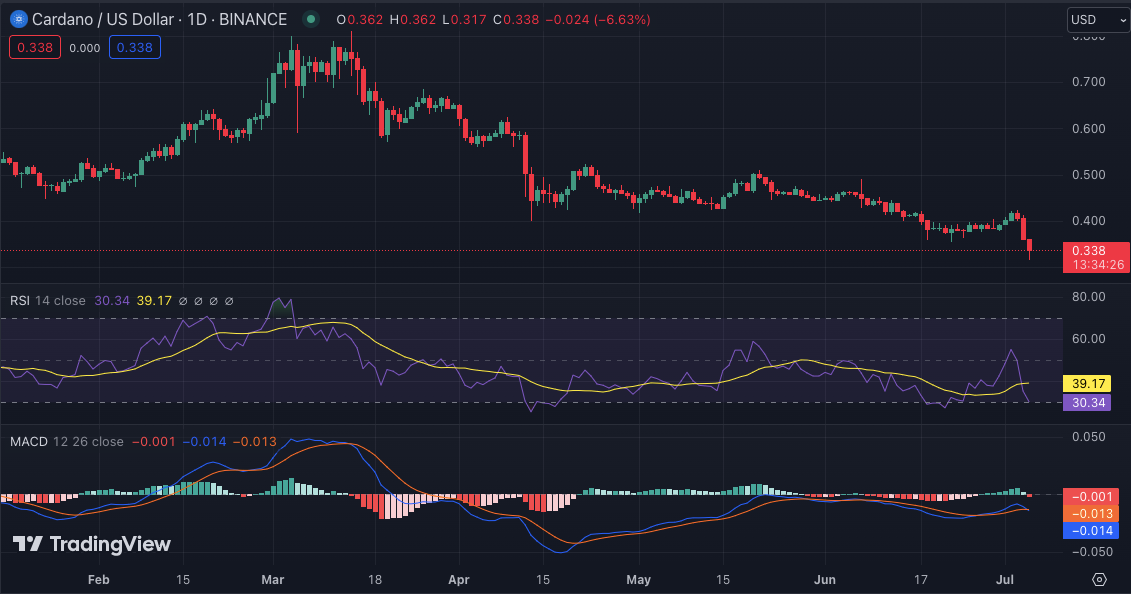
The 24-hour technical indicators for Cardano (ADA) show a notable decline in its trading price. The Relative Strength Index (RSI) is currently at 30, which positions ADA in the oversold territory. This could indicate an opportunity for investors, as prices might rebound after such a dip.
The Moving Average Convergence Divergence (MACD) shows a bearish crossover, with the MACD line crossing below the signal line. This suggests that the downward momentum may continue in the short term.


