


- LINK’s pivotal $13.000 support faces a critical test amidst heightened selling pressure and resistance at $16.000 and $18.000.
- RSI at 29.53 indicates oversold conditions, possibly signaling a near-term reversal for Chainlink.
- $11.46 current price reflects a 13.62% decline, emphasizing prevailing bearish sentiment for Chainlink.
Chainlink faces a critical juncture, teetering near the pivotal $13.000 support level, as underscored by analyst Satoshi Flipper. Historically, LINK has displayed notable volatility, oscillating from a low of $5.600 to a high peak of $22.868. Presently, the token stands at $13.004, with its recent trajectory indicating a struggle near crucial resistance and support zones.
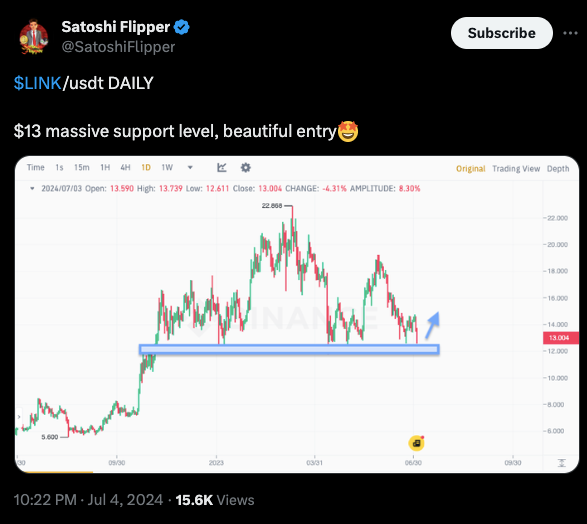
The $13.000 mark has emerged as a significant support level, having withstood multiple tests, underscoring robust buying interest whenever prices approach this threshold. Conversely, the peak at $22.868 poses a formidable resistance barrier, coupled with intermediate hurdles at $18.000 and $16.000, where prior attempts at upward momentum were halted.
Current price action reveals LINK’s proximity to the $13.000 support, a critical juncture signaling a potential rebound or further downturn. Recent sessions have seen increased selling pressure, evident from the prevalence of red candles in the chart, indicating bearish sentiment prevailing in the short term.
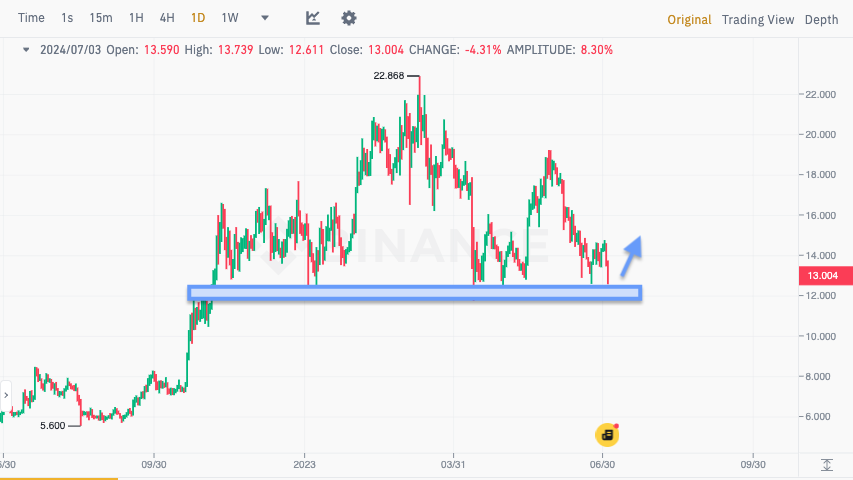
In assessing potential scenarios, a bullish outlook hinges on maintaining above the $13.000 support, potentially paving the way towards testing resistance levels at $16.000 and $18.000. A breakthrough above these barriers could propel LINK towards retesting its peak at $22.868. Conversely, a breach below $13.000 may trigger a bearish trend, possibly targeting lower supports around $10.000 or lower.
Bullish Breakouts can be Expected for LDO, DOT, BONK, and LINKAs at press time, Chainlink trades at $11.46, registering a 24-hour trading volume of $618,913,115. Recent performance indicates a decline of 13.62%, underlining the current bearish sentiment.
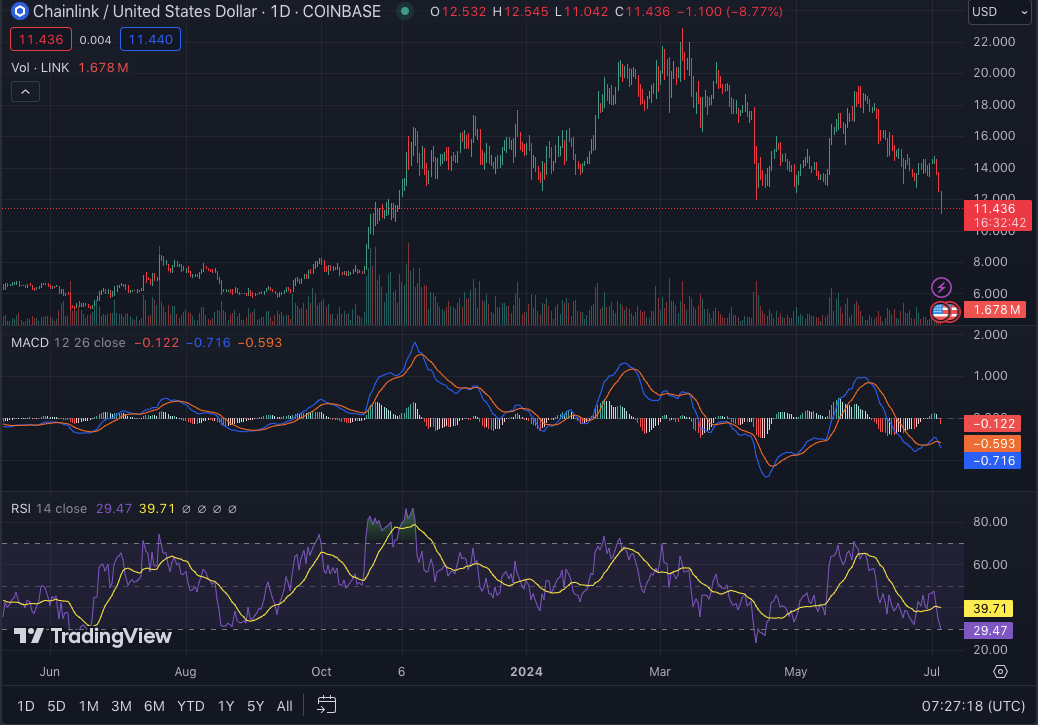
The 1-day Relative Strength Index (RSI) stands at 29.53, suggesting oversold conditions and hinting at a potential reversal in the near future. Meanwhile, the 1-day Moving Average Convergence Divergence (MACD), trading below the signal line at -0.715, signals potential further downside momentum in the short term.


