


- Amid market uncertainties, Chainlink showcases resilience, holding crucial support and forming consistent Higher Lows, signaling potential upward momentum.
- Despite a suboptimal Monthly Close, Ocean Protocol eyes a bullish breakout by reclaiming red Range High, bolstered by supportive Weekly Close scenarios.
- Rekt Capital notes Polkadot’s breakthrough in major market structure, indicating a potential Macro Uptrend, with technical indicators aligning for sustained positive momentum.
In the ever-evolving realm of cryptocurrency, the focus has recently shifted to three notable assets—Chainlink ($LINK), Ocean Protocol ($OCEAN), and Polkadot ($DOT). A thorough examination of Rekt Capital’s series of tweets unveils detailed technical analyses of these tokens, offering valuable insights into market trends and potential opportunities.
Notably, Rekt Capital, a seasoned crypto analyst, highlighted $LINK’s sustained support at the red zone bottom, forming a third consecutive Higher Low:
$LINK
— Rekt Capital (@rektcapital) November 29, 2023
Continues to find support at the bottom of the red support here
Forming a Higher Low at downside wicks for the third week in a row#LINK #Crypto #Chainlink https://t.co/oKGmg7pA7B pic.twitter.com/VCPi1Q4yLP
Rekt Capital observes a noteworthy scenario for Chainlink as it clings to the support level within the defined red box. The resilience demonstrated by LINK in holding the bottom of this range is crucial for the coin to regain upward momentum.
Rekt Capital emphasized the importance of continued price stability, suggesting that it is a prerequisite for Chainlink to resume its uptrend. The identification of a Higher Low formation for the third consecutive week underscores the coin’s ability to weather short-term downside pressure, a positive sign for investors and traders alike.
Chainlink (LINK) is currently trading at $15.77, reflecting a 6.51% increase over the last seven days. In the crypto market, it holds the 12th position with a market cap of $8,783,253,041 and a 24-hour trading volume of $626,419,554, constituting 7.02% of its market cap.
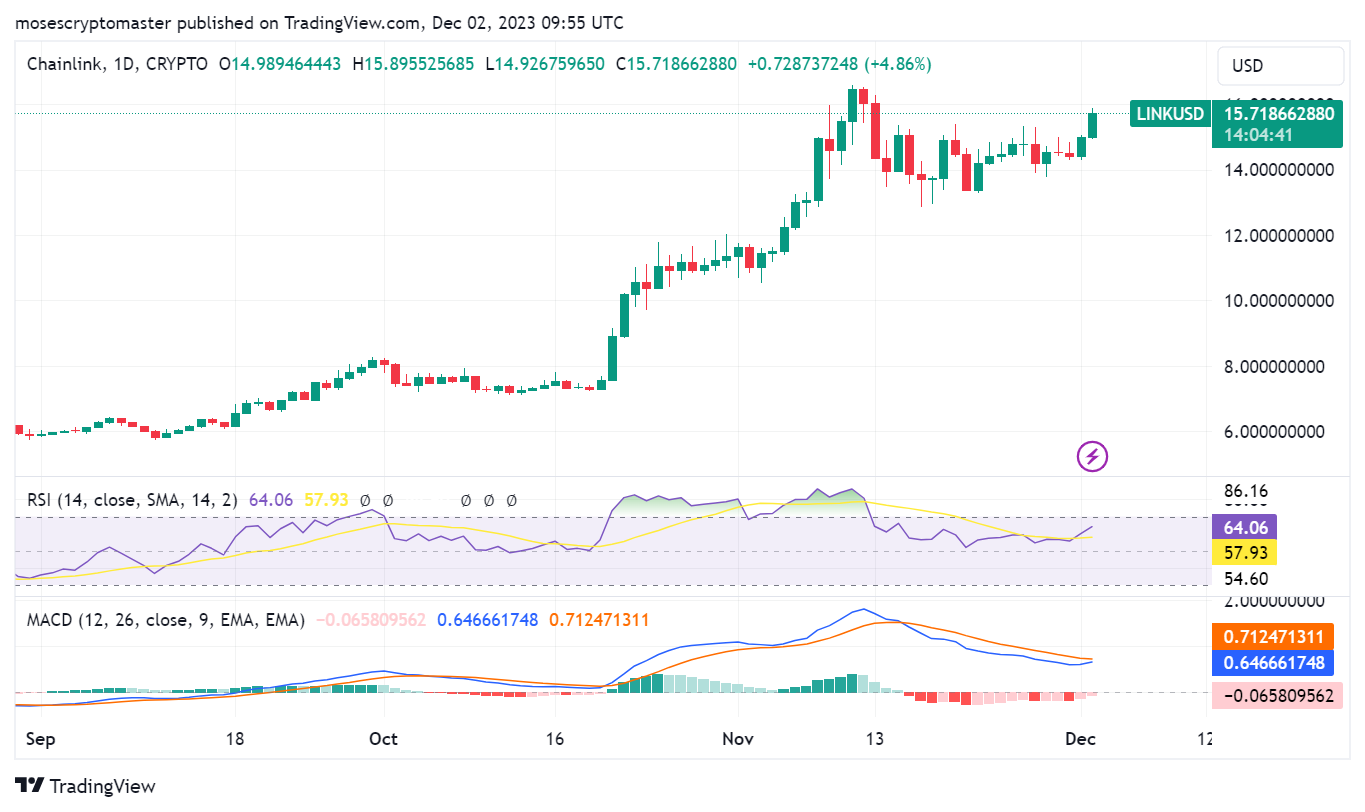
Both the 50-day and 200-day moving averages for LINK are on an upward trajectory, indicating a bullish trend in the medium and long term. The Relative Strength Index (RSI) at 52 places LINK in the neutral zone, suggesting a balanced market sentiment where it is neither overbought nor oversold. The stochastic oscillator is currently in the oversold region, signaling a potential rebound, a crucial factor for traders to monitor closely.
In another tweet, Rekt Capital evaluated $OCEAN’s Monthly Close, emphasizing the potential for a breakout if the red Range High is reclaimed:
$OCEAN
— Rekt Capital (@rektcapital) December 1, 2023
Arguably not the best Monthly Close
Technically, price is still in the range
But if OCEAN is able to reclaim red Range High as support –> confirm the breakout
A Weekly Closes above red would increase the chance for a breakout#OCEAN #Crypto #Oceanprotocol https://t.co/bXEgdaGgwY pic.twitter.com/2iR8VPS1zV
Turning attention to Ocean Protocol, Rekt Capital pointed out the recent Monthly Close, describing it as less than optimal. Despite being technically within a range, there is potential for a bullish breakout if OCEAN manages to reclaim the red Range High as support. The analyst highlighted the significance of a Weekly Close above the red range, as it would substantially increase the likelihood of a breakout.
Rekt Capital provided a comprehensive analysis of the Monthly Close, indicating that a close above the red resistance would be considered bullish. On the flip side, any downward movements into the green region would be seen as a retest of the Range Low, forming part of the consolidation within the established green-red range.
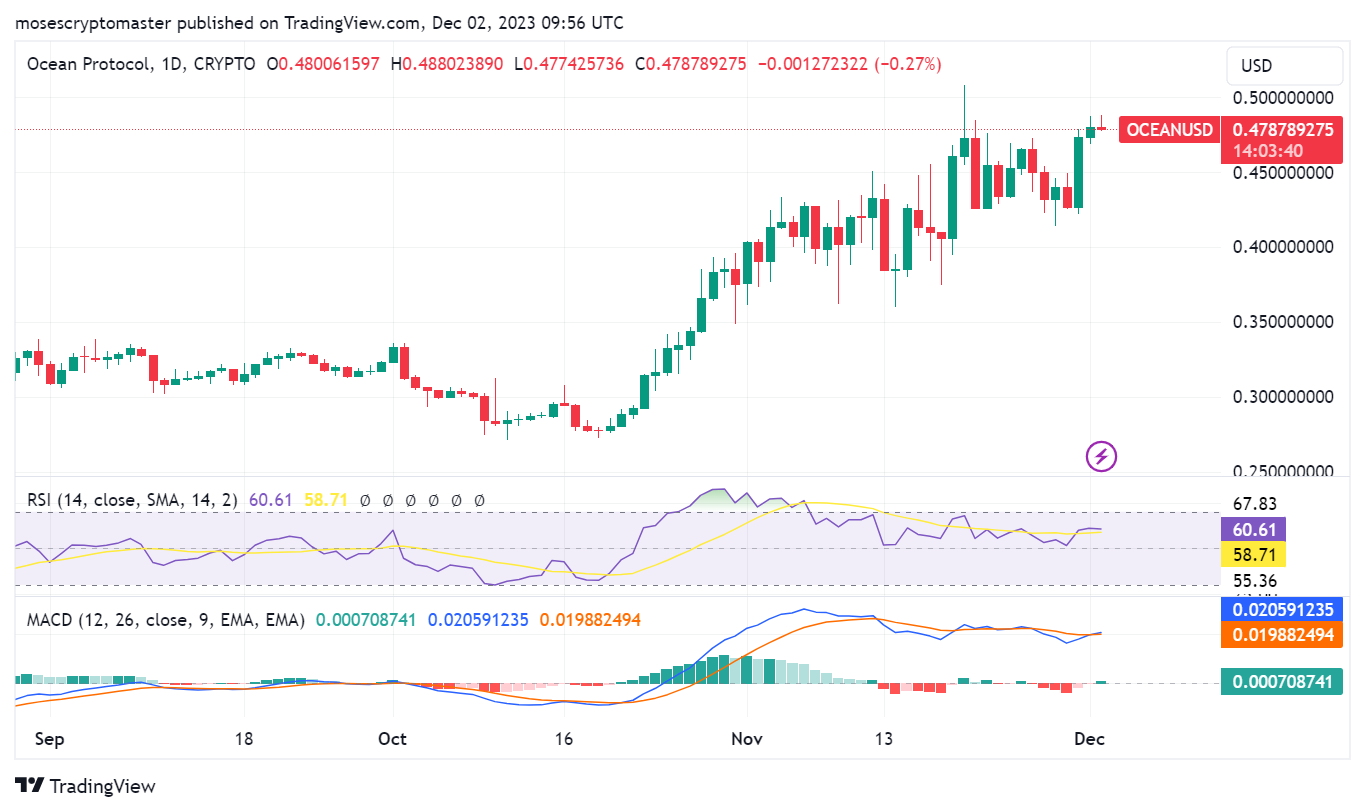
Ocean Protocol (OCEAN) is currently valued at $0.4793, reflecting a 4.44% increase over the past seven days. It holds the 146th position in the market with a market cap of $272,429,073. The 24-hour trading volume is $28,390,983, accounting for 10.74% of its market cap.
Rekt capital astutely noted the official breakout of Polkadot ($DOT) from its major market structure, foreseeing potential Macro Uptrend confirmation with any top pattern dips:
$DOT
— Rekt Capital (@rektcapital) December 1, 2023
Polkadot has officially broken out from its major market structure
Any dips into the top of the pattern, if they occur at all, will likely fully confirm the breakout in a new Macro Uptrend#DOT #Crypto #Polkadot pic.twitter.com/tDpjLAvqrC
In the realm of Polkadot, Rekt Capital reported a significant breakthrough in the coin’s major market structure. The tweet suggests that Polkadot has officially broken out from its established market pattern, and any potential dips into the top of this pattern could further confirm the breakout, signaling the initiation of a new Macro Uptrend. This observation is crucial for investors, as it implies the potential for sustained positive momentum in the broader market. Rekt Capital’s analysis provided a clear indication of the bullish sentiment surrounding Polkadot, as it capitalizes on its newfound market structure.
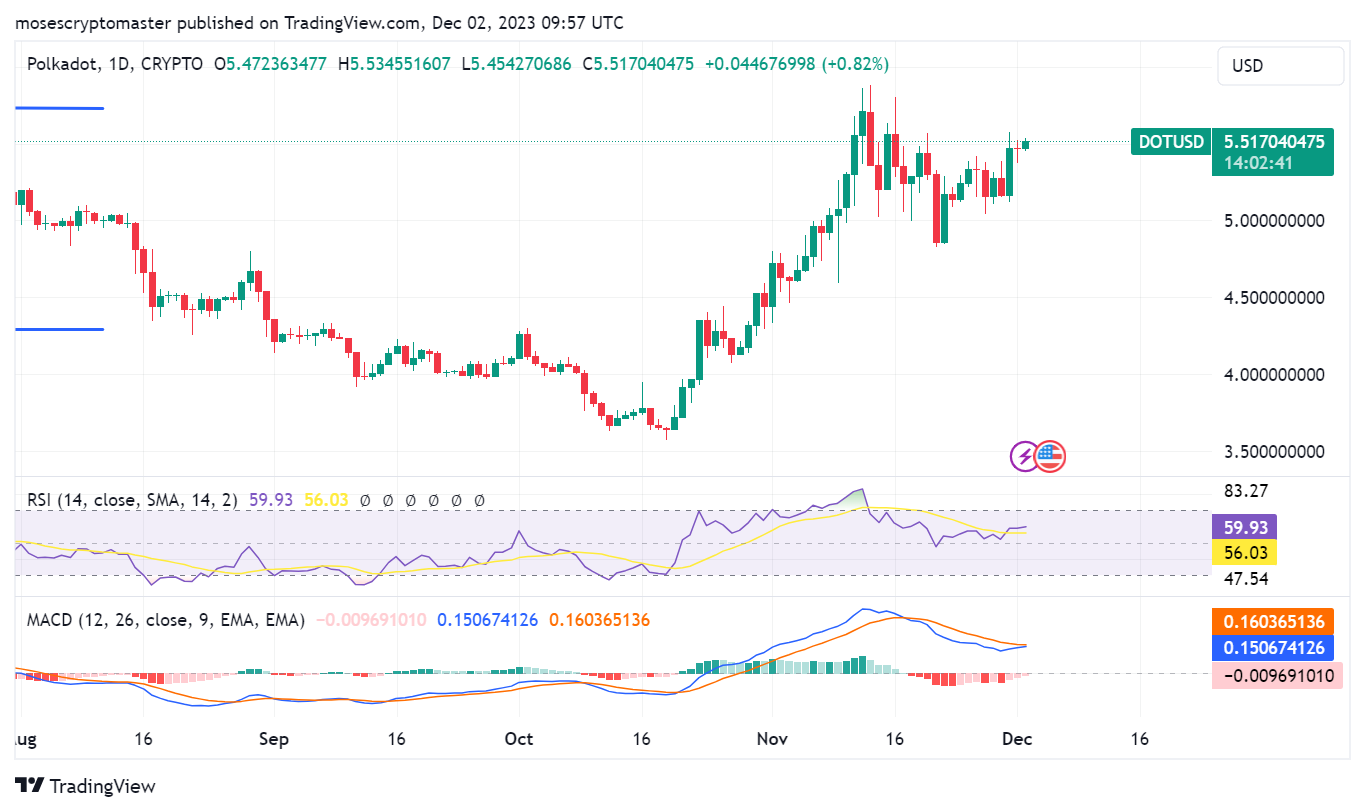
Polkadot (DOT) is currently priced at $5.51, displaying a 3.89% increase over the past seven days. With a market cap of $7,248,914,573, DOT holds the 15th position in the market. The 24-hour trading volume is $125,909,186, constituting 1.84% of its market cap.
Analyzing key technical indicators, the 200-day moving average for DOT is positioned below the current price, suggesting a long-term uptrend. The RSI at 52.44 indicates a neutral market sentiment, neither overbought nor oversold. The positive MACD reinforces the bullish trend. Notably, DOT is forming a cup and handle pattern, a bullish continuation signal, suggesting potential upward movement in the near future.
In conclusion, these analyses by Rekt Capital shed light on the technical intricacies of these three prominent cryptocurrencies. Investors and enthusiasts alike are advised to closely monitor these developments as they navigate the ever-evolving landscape of the crypto market.


