


- Resistance at $3050 remains a significant hurdle for Ethereum’s price, indicating ongoing selling pressures.
- Ethereum’s resilience at support levels around $2780 and $2660 reflects strong buying interest.
- Technical indicators suggest a mixed outlook, with potential oversold conditions but also looming downward momentum.
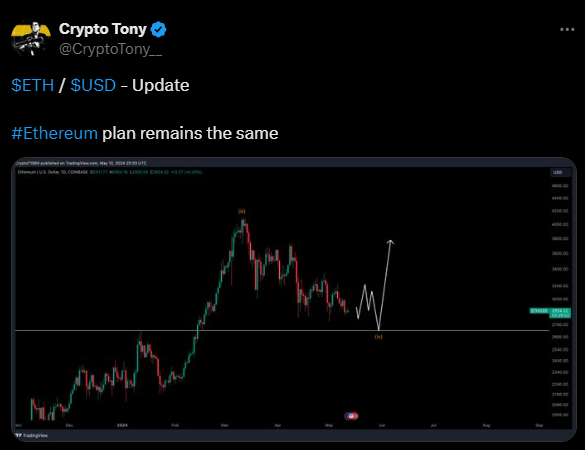
Ethereum (ETH) faces a pivotal juncture in its price trajectory against the US dollar as Crypto Tony, a top analyst, states that Ethereum plan remains the same. Analyzing recent trends and key support and resistance levels provides insights into potential future movements.
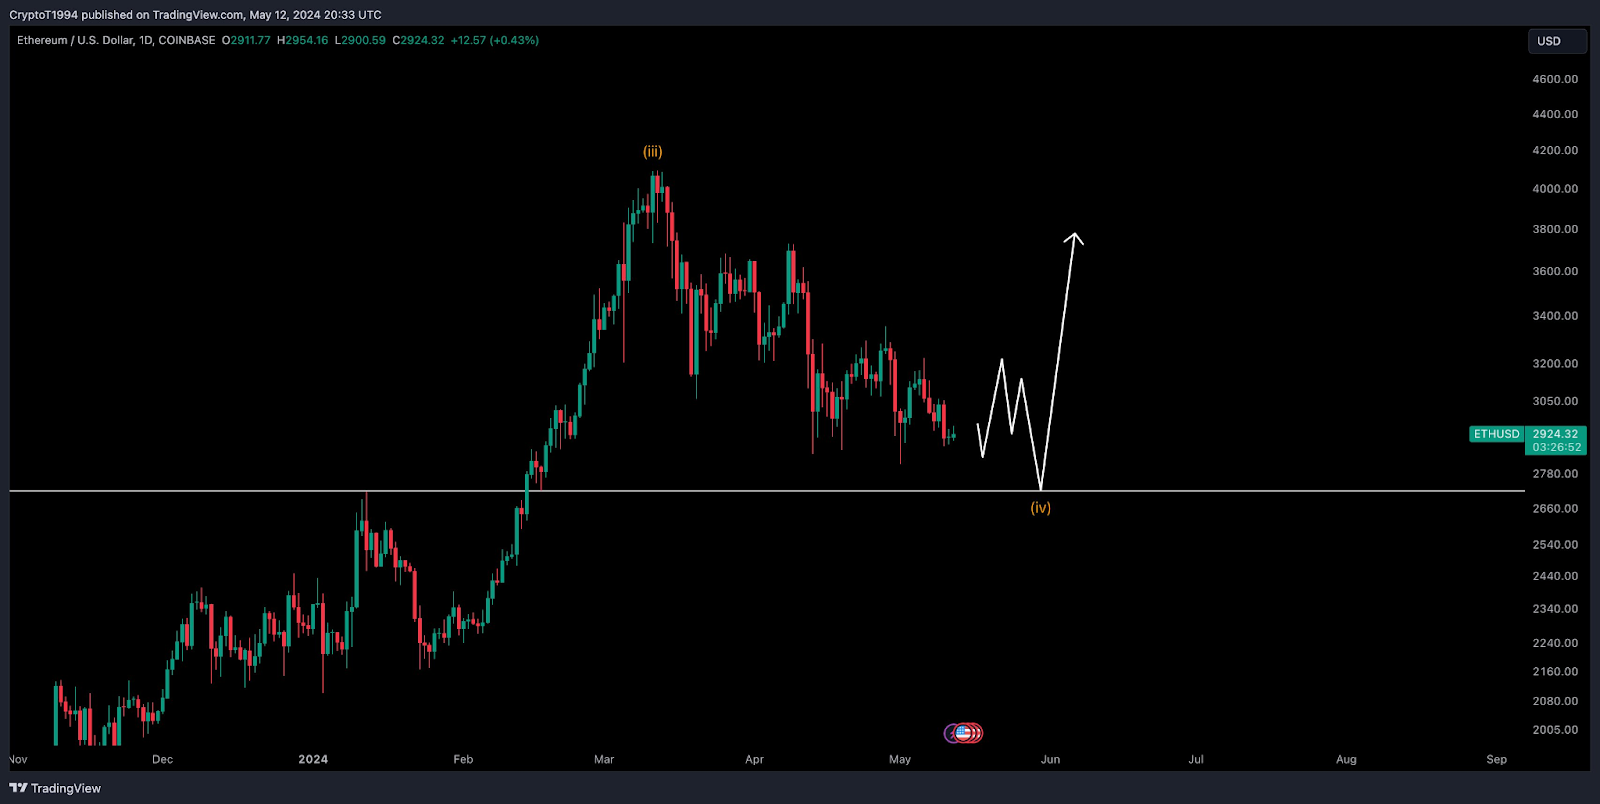
Support and resistance levels serve as crucial markers for traders, offering valuable guidance for decision-making. Notably, Ethereum has shown resilience around the $2780 and $2660 support levels, reflecting strong buying interest at these price points. Conversely, resistance at $3050 has proven formidable, with repeated attempts at breaking through met by selling pressures.
Chart projections outline a pattern of volatility, characterized by smaller peaks and troughs, hinting at a possible bullish sentiment emerging. Should Ethereum manage to breach the $3050 resistance, it could pave the way for testing higher barriers around $3400.
As per analyst Benjamin Cowen’s analysis recent price movements depict Ethereum’s trajectory on the Kraken exchange, showcasing notable volatility and a robust bullish trend in early 2024, followed by a recent pullback. The $2600 support zone, as indicated by the green moving average line, has demonstrated Ethereum’s resilience in the face of market fluctuations. Additionally, the $2886.62 price level may offer short-term support, considering its proximity to the moving averages.
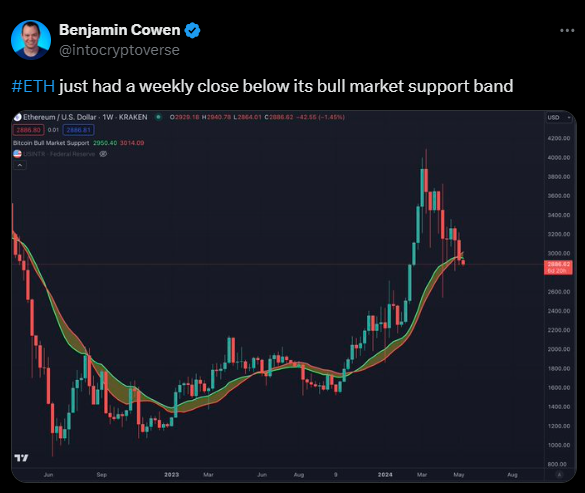
Resistance levels remain prominent near recent highs of $3400, with $3200 serving as a short-term barrier to upward momentum. The recent crossover of moving averages, typically signaling a bearish shift, underscores the importance of Ethereum stabilizing and reclaiming levels above the green moving average to negate this bearish signal.
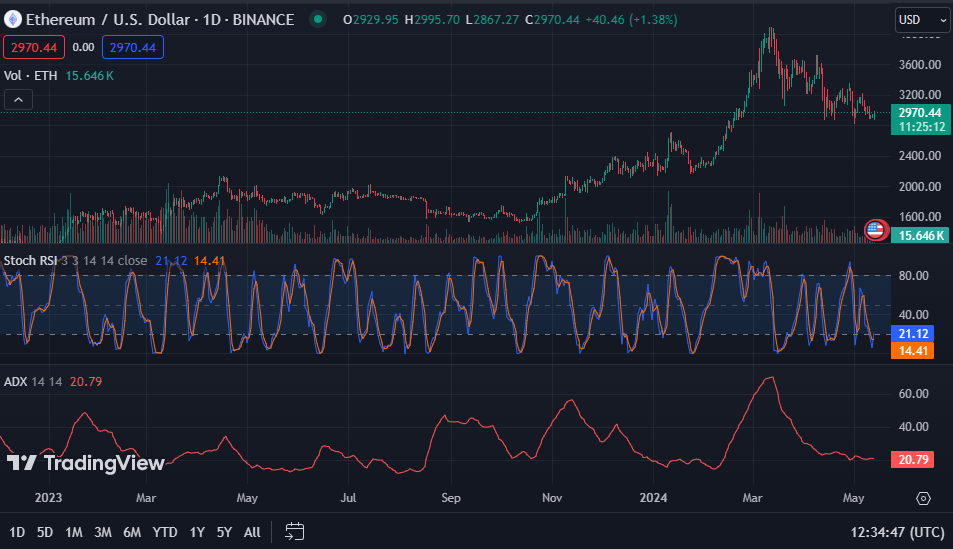
Trading at $2,965.75 at press time, Ethereum’s technical indicators provide further insights into the token’s current status. The stochastic RSI reading above the signal line suggests potential oversold conditions in the short term, potentially indicating a reversal in price. However, the MACD trading below the signal line hints at downward momentum looming in the near future. The ADX reading suggests a weakening trend for Ethereum, adding another layer of complexity to its price dynamics.


