


- Bitcoin’s potential breakout above $74K resistance could target $88K, fueled by a bullish cup and handle pattern.
- Historical cycles suggest 2024 and 2025 might be green years, continuing Bitcoin’s alternating red-green trend.
- Current consolidation at $68K hints at imminent movement; volume increase will be crucial for validating the breakout.
Bitcoin appears poised for a significant breakout as the cryptocurrency hovers just below the critical $70,000 mark. Moustache, an analyst, suggests that a Right-Angled Descending Broadening Wedge is hinting at a potential bullish run.
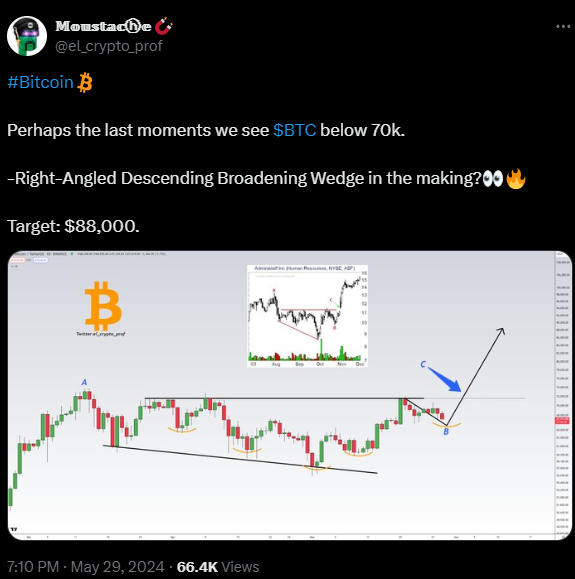
The cup and handle pattern is a well-known bullish continuation indicator. It typically signals an impending breakout above a resistance level. Point A on the chart marks the peak of the left side of the cup, where Bitcoin’s price reached a high before beginning its decline. This decline found a bottom around point B, forming a rounded bottom characteristic of the cup. Currently, the handle appears to be taking shape, suggesting consolidation before a possible surge past the resistance.
Bitcoin’s Long-Term Holders Signal a Bull Run: Here’s WhySignificant resistance lies around the $74,000 mark. This horizontal line has been tested multiple times, indicating its robustness as a resistance zone. The support trendline, represented by a descending black line, underscores the upward sloping support base of the handle. Additionally, the $65,000 level has consistently acted as a minor support, as shown by the orange curved lines.
Possibility of Bitcoin’s Breakout
Bitcoin is within the handle formation, showing signs of consolidation. A breakout above the $74,000 resistance, backed by substantial trading volume, could propel Bitcoin towards the $88,000 target. This projected rise is underscored by a noticeable upward arrow on the chart.
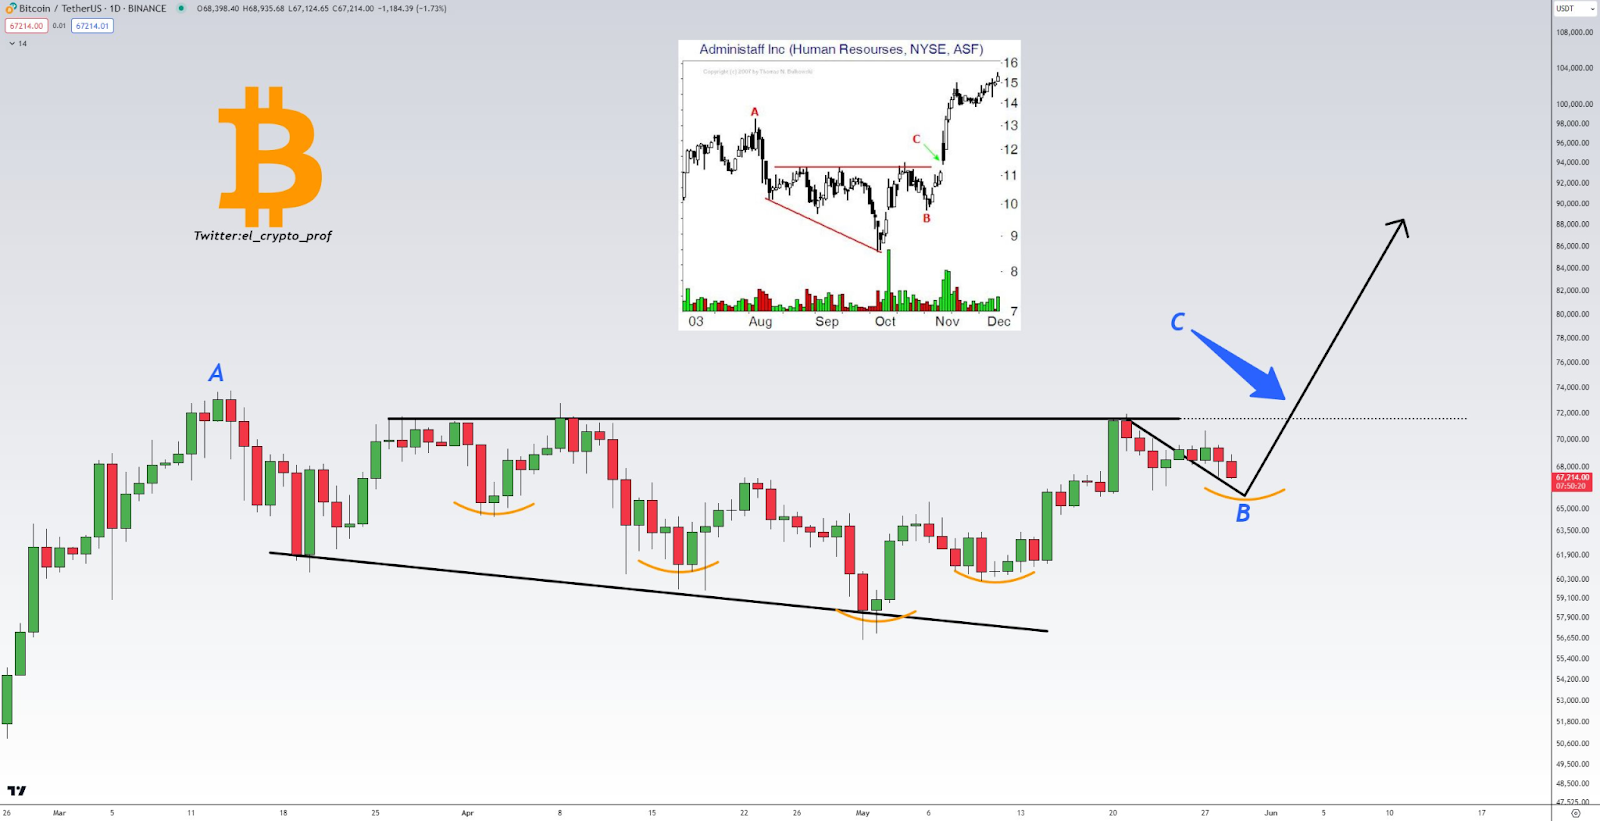
Although not explicitly depicted in the main chart, historical patterns suggest that volume increases during breakouts. If Bitcoin surges past the $74,000 resistance with high volume, it will validate the cup and handle formation, aiming for higher levels between $88,000 and $90,000. Conversely, failing to breach this resistance could lead to further consolidation or a retest of the $65,000 support level.
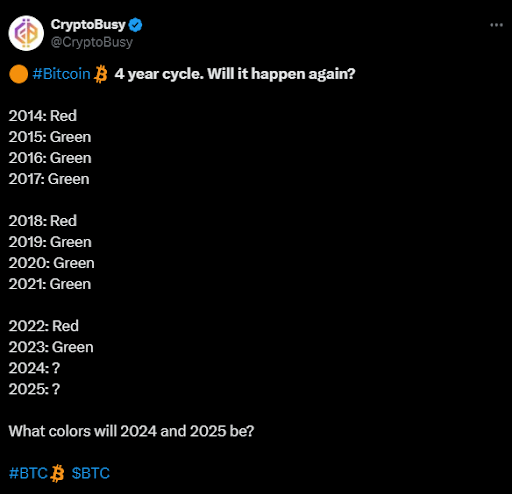
As further highlighted by CryptoBusy, a top analyst, every four years appears to follow a similar color trend, alternating between red and green years. 2014, 2018, and 2022 were red years, while 2015, 2019, and 2023 were green. If this pattern holds, 2024 and 2025 could potentially follow the green trend.


