


- Bitcoin’s recent correction amid S&P 500 highs highlights its decoupling from traditional market trends.
- Despite short-term dips, Bitcoin’s long-term trend remains bullish, outperforming the S&P 500 since 2022 lows.
- Key Fibonacci levels suggest Bitcoin is consolidating, potentially setting up for significant future gains.
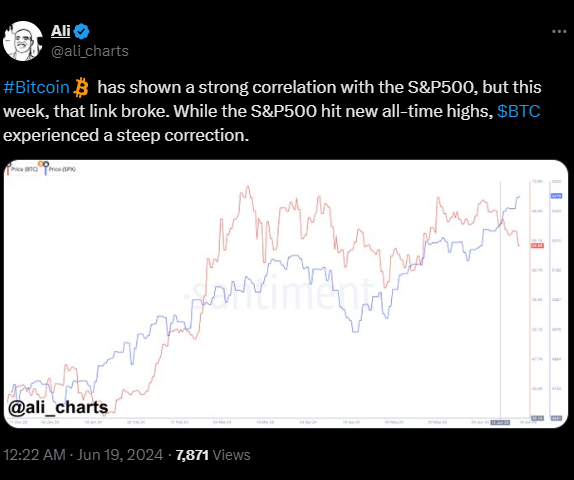
Bitcoin, typically seen moving in tandem with the S&P 500, experienced a divergence this week. As highlighted by Ali Martinez, a top analyst, the S&P 500 reached new all-time highs, and Bitcoin faced a sharp correction. This decoupling has led many to question Bitcoin’s performance relative to stocks.
As further noted by Charting Guy, an analyst, since the 2022 lows, Bitcoin has been outperforming the S&P, with the BTC/USD-SPY pair consolidating around a significant support level. This setup appears extremely bullish.
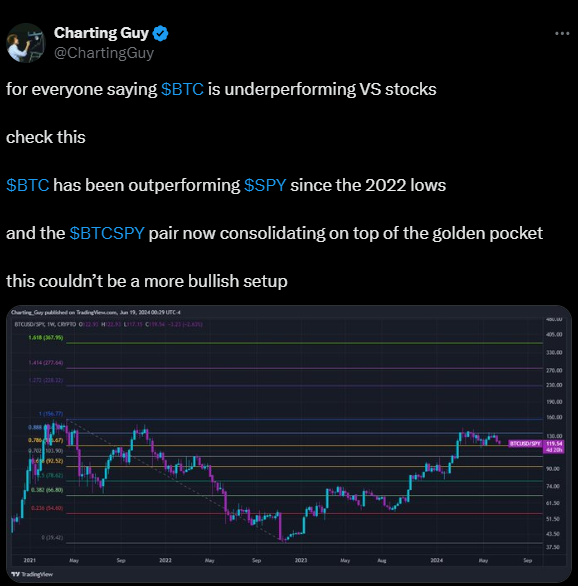
The BTC/USD-SPY chart, set on a weekly timeframe, shows Bitcoin’s price trend against the S&P 500. The chart is detailed with several Fibonacci retracement and extension levels. These levels help identify potential support and resistance areas.
The 0.236 Fibonacci level, at 54.60, is the first significant support in a retracement. It indicates a weak correction within the overall trend. Next, the 0.382 Fibonacci level at 66.80 serves as moderate support, often hinting at a potential reversal or continuation. The 0.5 level, at 78.62, though not a true Fibonacci number, is widely seen as crucial support or resistance.
Bitcoin Mining Costs Surge Post-Halving, Industry Faces Major ChallengesThe 0.618 level, at 92.52, is one of the most critical, often acting as a strong support area. The 0.786 level, at 119.67, indicates a deeper retracement and can serve as a robust support zone. For resistance, the 1.0 Fibonacci level at 156.77 represents the previous high. Breaking above this level could signal a continuation of the uptrend.
The 1.272 Fibonacci extension, at 228.22, indicates potential targets in the next bullish phase. The 1.414 extension, at 277.64, signifies another target if the price continues to climb. Finally, the 1.618 extension, at 367.95, often serves as significant resistance in an extended bullish run.
From mid-2022 to the present, the overall trend shows a bullish movement, with consistently higher highs and higher lows. Recently, the price encountered resistance around the 119.67 level (0.786 Fibonacci retracement), struggling to break through this zone.
Currently, the price is consolidating just below this level, suggesting a potential retest of support levels. As of press time, Bitcoin’s live price is $65,491.74, with a 24-hour trading volume of $35,091,102,312, down 0.30% in the last 24 hours.


