


- XRP could reach 17.39% market dominance by surpassing BTC despite historical downtrends and current skepticism.
- Key support and resistance levels for XRP are crucial, with potential rebound targets at Fibonacci levels up to 17.39%.
- Technical indicators show that XRP is approaching oversold territory, signaling a buying opportunity.
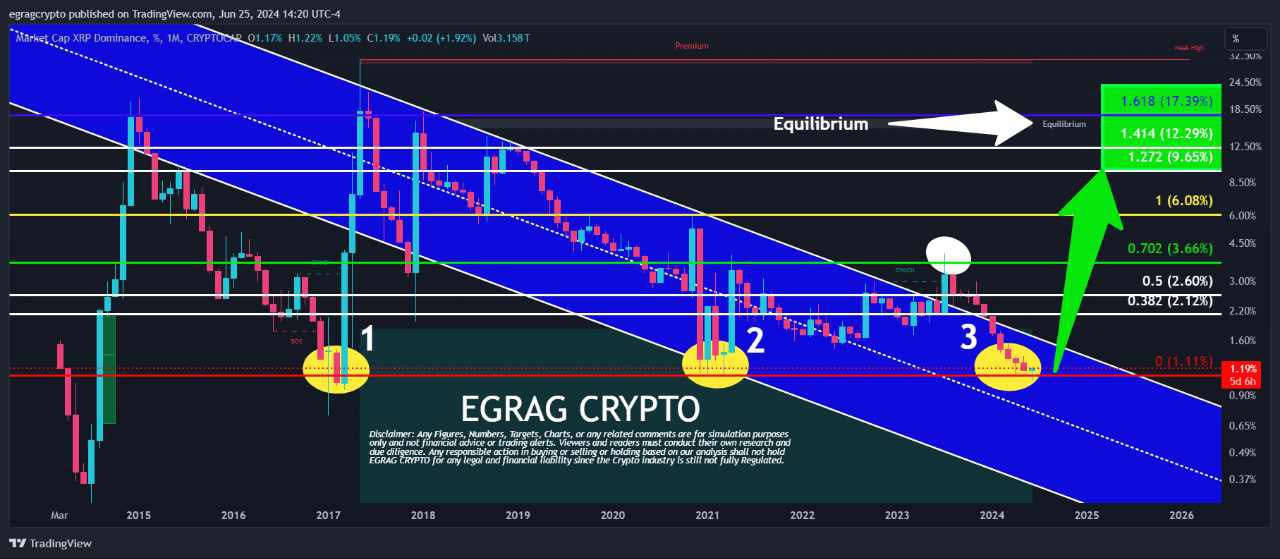
XRP’s dominance in the cryptocurrency market is poised for a significant shift as believers remain steadfast in their faith despite ongoing skepticism. As highlighted by EGRAG CRYPTO, a top analyst, XRP’s market cap dominance is projected to retest equilibrium and the Fibonacci 1.618 level, reaching 17.39%. This bullish forecast suggests that XRP could eventually surpass Bitcoin (BTC) in market dominance, a feat only a few anticipate.
Historically, XRP has moved within a descending channel, marked by clear support and resistance levels. Key support levels are observed at 0.382 (2.12%) and 0.1118%, while resistance levels include 0.5 (2.60%), 0.702 (3.66%), and 1 (6.08%).
Additionally, higher Fibonacci levels, such as 1.272 (9.65%), 1.414 (12.29%), and 1.618 (17.39%) serve as crucial targets. These levels reflect significant historical price movements, with notable drops in 2017 and 2020. A recent low in 2024 suggests a potential rebound.
Thailand Explores XRP Adoption Amid Ripple’s Global Expansion: ReportThe concept of equilibrium is essential in understanding XRP’s market behavior. It represents a stabilization point where the price might balance before making significant moves. The chart analysis indicates that if XRP breaks out of its downtrend channel, it could potentially climb toward the 1.618 level at 17.39%. This upward projection is visually represented by a green arrow, signaling optimism among XRP supporters.
As per the latest data fetched during writing, XRP was trading at $0.474476, with a 24-hour trading volume of $856,325,972. Data showed that XRP stumbled a slight decrease of 0.78% over the last day. Despite this, technical indicators suggest that XRP is approaching oversold territory, with the 1-week Relative Strength Index (RSI) reading at 39.57.

This could indicate a buying opportunity for traders seeking to enter the market at a lower price point. However, the 1-day Moving Average Convergence Divergence (MACD) trading below the signal line suggests further downward momentum in the short term.


