


- Solana’s primary support zone at $115-$125 is crucial for potential price reversal amid current volatility.
- Immediate resistance at $160-$170 must be overcome for bulls to regain momentum and challenge higher levels.
- The 1-week RSI at 55.11 and MACD below the signal line suggest neutral to short-term bearish market sentiment.
The daily price chart of Solana (SOL) has shown significant volatility, with sharp movements both upward and downward. According to EliZ, an analyst, SOL experienced a strong upward trend, peaking around $210. This was followed by a substantial decline, indicating a bearish phase.
Recently, the price appears to have entered a corrective phase, attempting to stabilize after several declines. This bearish phase suggests a volatile market in which the price has struggled to maintain upward momentum.
Currently, SOL is attempting to find support and establish a new trend direction. The key support zone is around $130 to $135, a significant area tested multiple times in the past. This range has seen numerous candlestick wicks and bodies interacting, indicating strong buying interest. If this support holds, it could provide a base for a potential reversal.
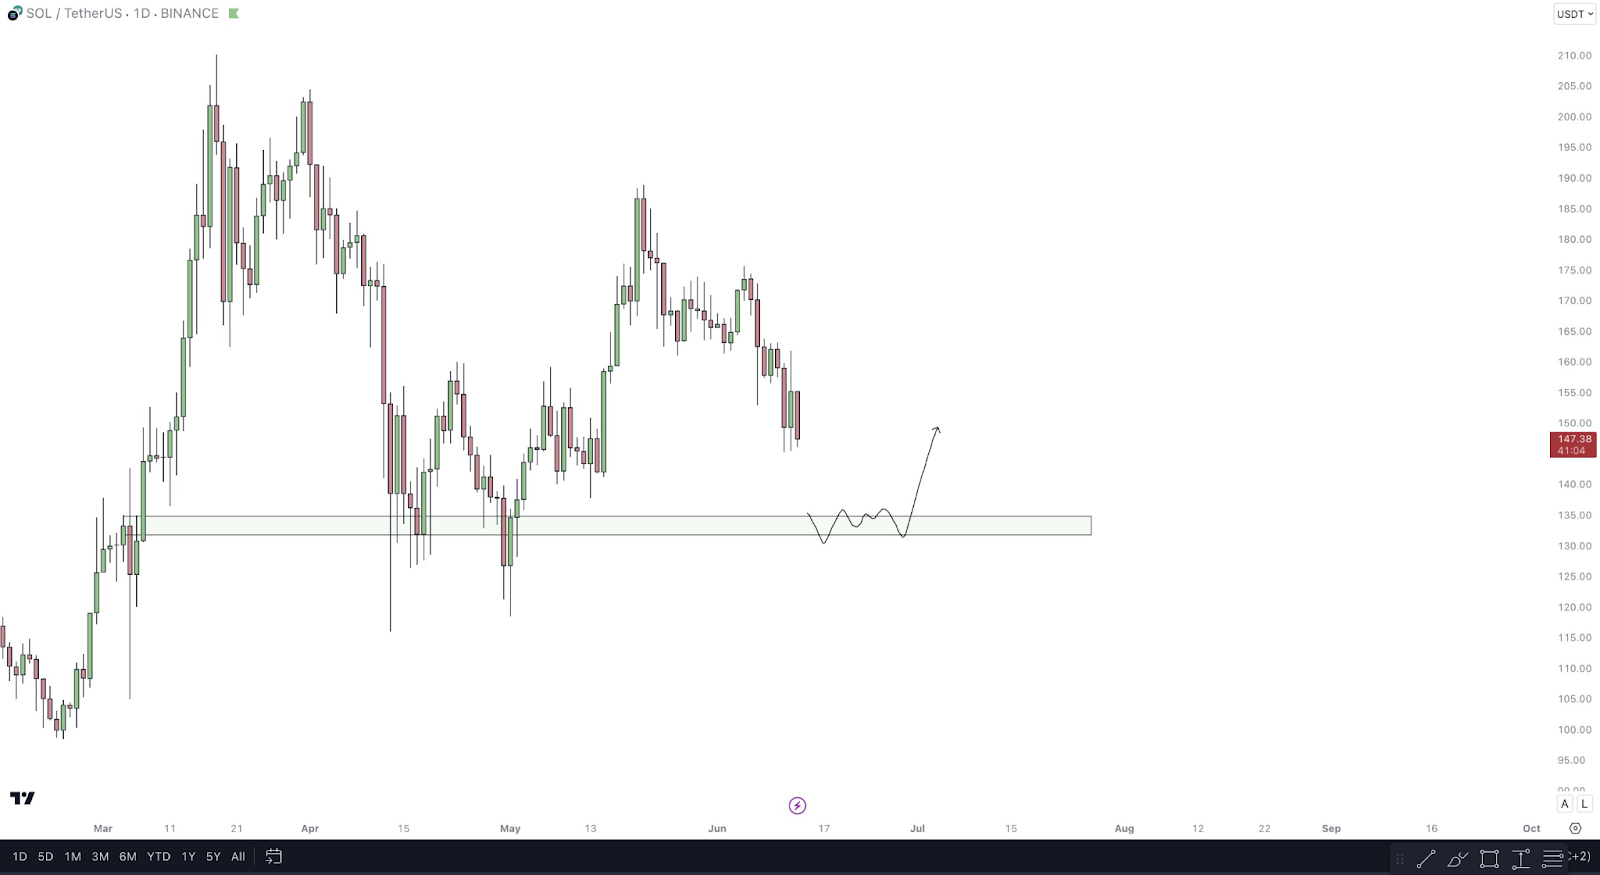
However, if the primary support fails, the next significant level to watch is around $100. This psychological level has previously acted as support and could attract buying interest again. On the upside, immediate resistance is found around $160 to $170, a range that has seen prior consolidation and rejection. This makes it a critical level for bulls to overcome.
Crypto Market Sees Mixed Trends: Bitcoin Steady Above $67K, Solana and XRP DeclineBeyond this, major resistance lies around $200 to $210, marking the previous peak. Breaking this level would suggest a resumption of a strong bullish trend.
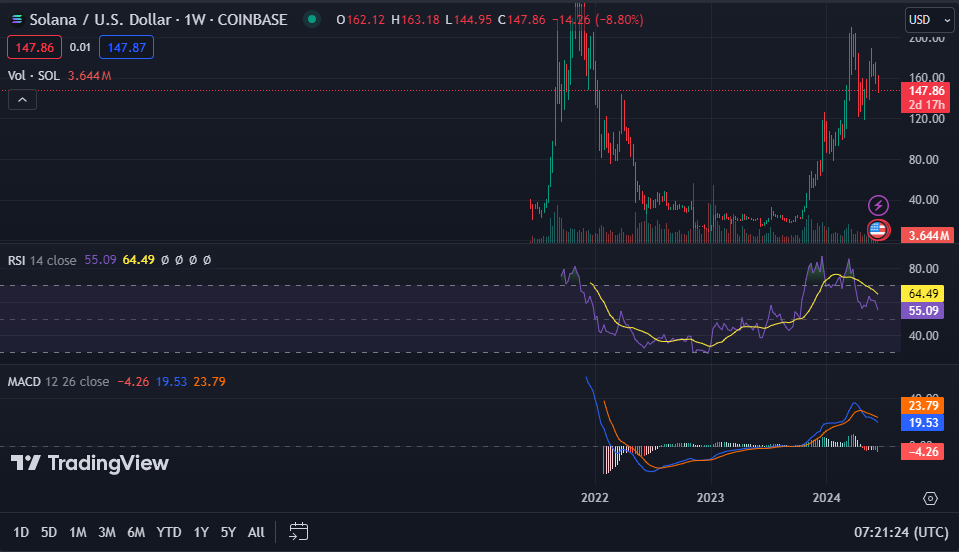
The current live price of Solana is $147.90, with a 24-hour trading volume of $2,039,957,871. Solana has decreased by 2.30% in the last 24 hours. The 1-week RSI for Solana reads 55.11, indicating a neutral position. This suggests a potential for further price movement in either direction. Additionally, the 1-week MACD trading below the signal line indicates a short-term bearish trend.


