- Anticipated altseason could push Bitcoin past $100K, driven by current extended market consolidation.
- Key support at 580B and resistance at 800B in 2024 could determine the direction of the altcoin market.
- Historical patterns suggest bearish sentiment often precedes significant altcoin rallies.
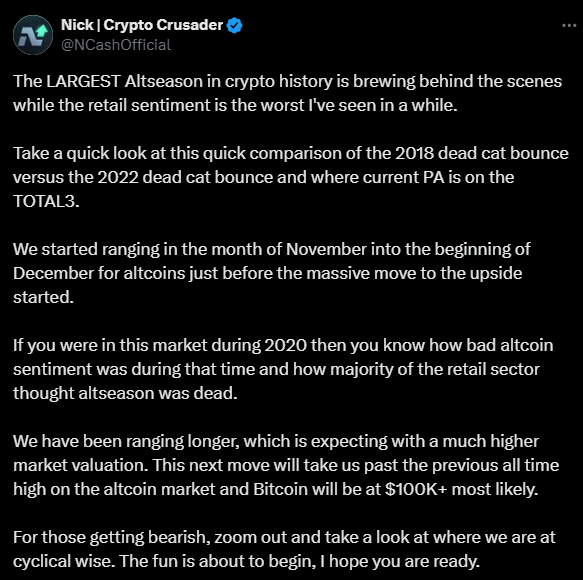
The cryptocurrency market is on the cusp of what could be the largest altseason in history despite the current bearish retail sentiment. As highlighted by Nick | Crypto Crusader, an analyst, the 2018 dead cat bounce and the 2022 dead cat bounce can offer valuable insights into current price actions. In 2018, altcoins began a notable rally after a period of stagnation similar to what is being witnessed now.

Historically, altcoin sentiment during market consolidation phases tends to be pessimistic. This pattern is evident in the altcoin market behavior during 2020, where bearish sentiment was prevalent before a significant uptrend.
The current market conditions reflect an extended consolidation phase, likely due to the higher market valuation compared to previous years. This extended range suggests that the next market movement could push altcoins past their previous all-time highs, with Bitcoin potentially exceeding $100K.
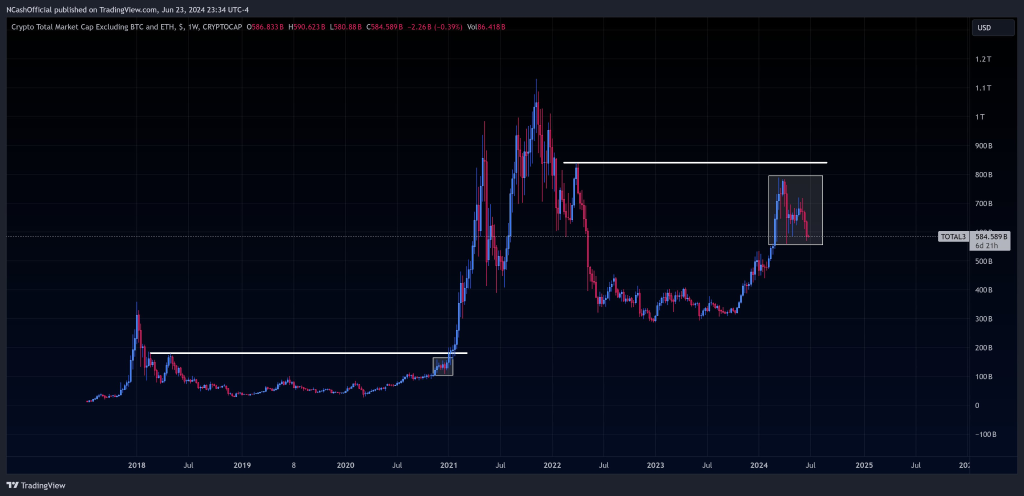
Analyzing the market trends, significant historical peaks and troughs provide crucial context. The market peaked in late 2017 to early 2018, followed by a sharp decline and a period of consolidation from 2018 to mid-2020. A strong uptrend began in late 2020, peaking in 2021, followed by another correction. Notably, the market embarked on an uptrend in late 2022, peaking in early 2024, and has since entered a consolidation phase.
Altcoin Market Cap Breakout Signals Potential Bullish Reversal for TradersIn 2024, the market exhibited an uptrend starting in late 2022, peaking around early 2024, followed by a consolidation phase. This consolidation is evident within a boxed region, reflecting a market adjustment period. Key support and resistance levels are crucial in understanding potential market movements.
Historically, significant support was around the 100B mark during the 2018 low. More recently, support has been around the 500B mark, acting as a buffer during the recent consolidation phase. Within the 2024 consolidation, the 580B mark serves as an intermediate support level.
Resistance levels also play a critical role in market behavior. Historically, the first major resistance was at approximately 1.1T, the peak in 2021. More recently, the 800B mark has acted as resistance during the uptrend and consolidation phase in 2024.

Source: Nick | Crypto Crusader
Observing these levels, the current price action indicates a consolidation phase within the 580B to 800B range. A breakout above the 800B resistance level could signal a new uptrend, while a breakdown below 580B might indicate further declines, potentially retesting the 500B support level.


