
Recently, the global cryptocurrency market has been stabilizing around its resistance levels. Bitcoin and altcoins are in a sideways movement which often serves as an indicator of an impending breakout that could lead to either a rise or fall in prices. At this moment, Bitcoin (BTC) is hovering near $17,000 while other major altcoins are getting close to their upper-bound resistance points; thus signifying a potential surge in value for these digital assets.
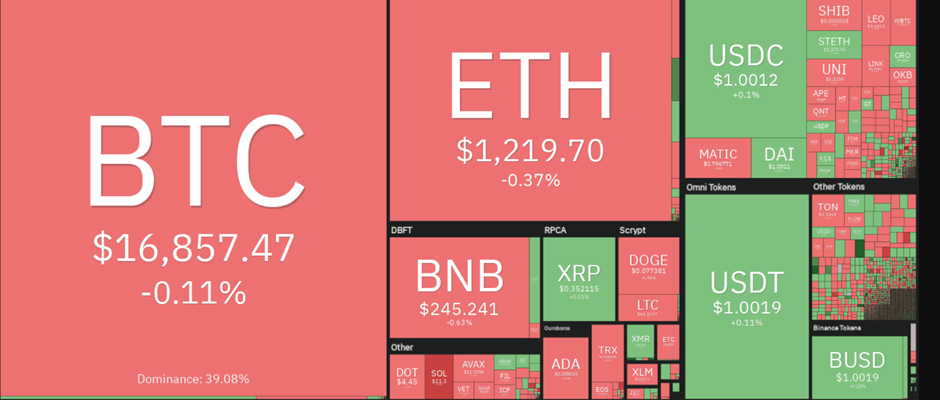
For the last several days, Bitcoin has been steadily hovering around $16,800 with buyers eagerly stepping in on dips. Like BTC, Ethereum is also stuck below its resistance at $1,300 but continues to remain strong above $1200.
The Total Crypto Market Cap has dropped from its pinnacle of $836 billion to the present rate of $811.2, yet a bullish engulfing candlestick formed on December 20th could point towards an upcoming uptrend that might push past the resistance line of $825 billion.
Conversely, if the closing prices of Bitcoin drop below $800 billion in its support area this could signify a bear market. This would consequently invalidate our bullish crypto prediction. In fact, Bitcoin has decreased by 65% from its peak and is currently facing its third bearish phase since 2014 and 2018 respectively.
Bitcoin is continuing to surge, consolidating around the critical $17,000 resistance point. Ethereum is also trading close to its own key resistance of $1,300. Decentraland shone as today’s best performer with a 6% uptick in value whereas Solana suffered losses of 4.42%.
Based on our overall market analysis, traders have not been deterred by declining cryptocurrency prices this year, but in fact, continue to invest heavily.
A report from Blockchain.com’s online survey demonstrate that confidence is still high in the future of crypto: an impressive 41% of respondents have purchased crypto recently, with another 40% planning to do so within the next 12 months. This illustrates a clear sign of faith in its potential for success going forward.
Despite this, the market will only see a sustainable recovery if inflationary pressures diminish. This would inspire investors to trust that the U.S. Federal Reserve will transition from harsh monetary policy enforcement and move towards an approach of economic growth initiatives instead.
BTC and ETH Technical Analysis
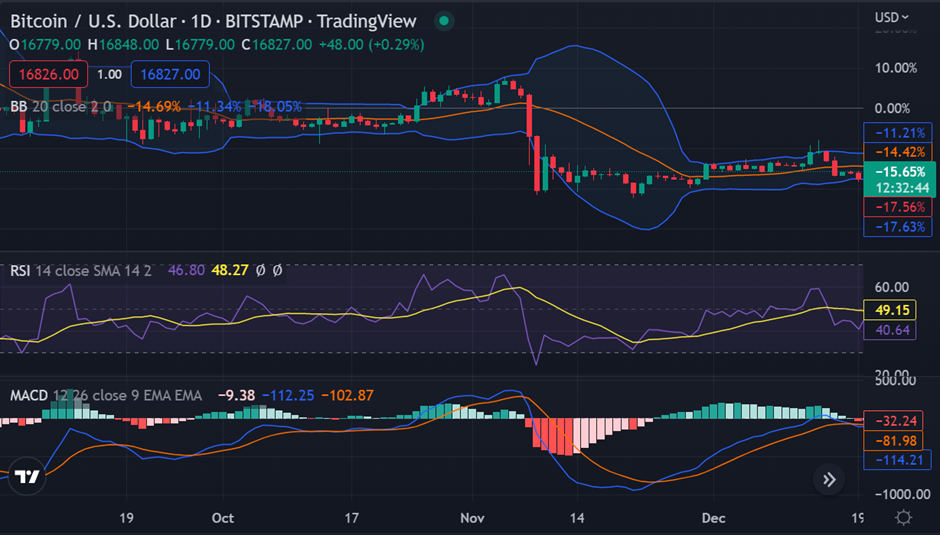
Bitcoin price opened the daily charts trading at $16,862 and has been trading in a tight range near the $17,000 resistance. If it breaks this level, the next resistance point is around $18,500, and a further breakthrough that would push BTC toward its all-time high of $20K.
The Relative Strength Index (RSI) bounced off the oversold zone to reach 57 while Bitcoin price traded between $16,900 and $17,000. The Moving Average Convergence Divergence (MACD) is moving sideways in the positive area and indicates a bearish trend if it moves below the zero line.
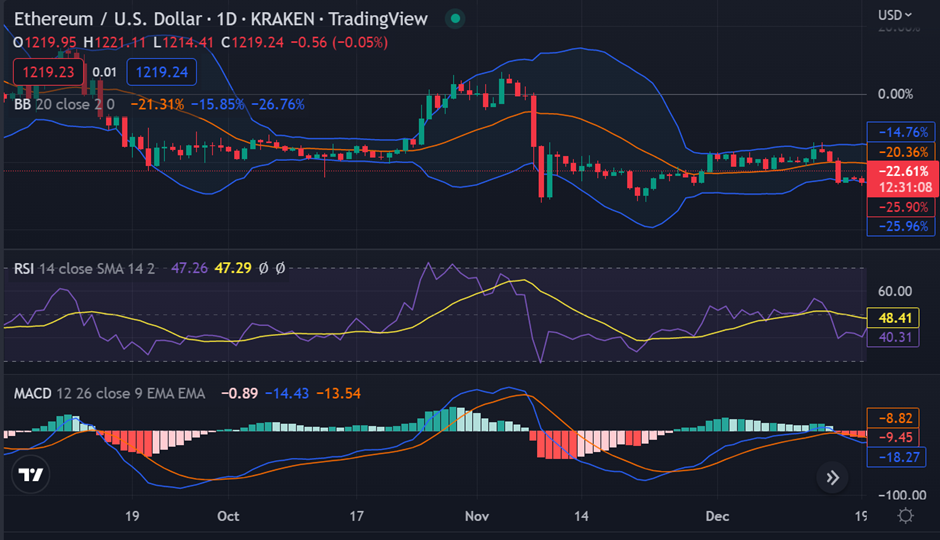
Ethereum has been consolidating around the $1,200 level and is inching closer to the crucial $1,300 resistance. The Relative Strength Index (RSI) is trending around 44 and looks set to enter into the neutral zone soon. Moreover, the Moving Average Convergence Divergence (MACD) has moved below the zero line and indicates a bearish trend for Ethereum.
The altcoins have been trading in a bearish trend in the last 4 hours, with select altcoins registering gains. Overall, the crypto market looks set for a break out soon as major coins like Bitcoin and Ethereum are trading close to their respective resistance points; however, uncertainty over U.S. monetary policy could hinder quick recovery.