


Volatility continues to stir the financial markets across the globe. U.S Treasury yields exert pressure on tech and other high-growth stocks
In the recent development, Alameda research, the sister company of now-bankrupt FTX, was seen transferring funds just a few days after the former CEO Sam Bankman Fried was released on a $250 million bond.
The wallet associated with the trading firm swapped bits of ERC20s for ETH/USDT following the Ether ETH $1,196 and USDT $1.00.
SOL, LDO, and APT nosedives amid market speculation
SOL tested 2022 yearly low
On the hourly time frame, the SOL price plunges nearly 9% and tested the low of $9.85. SOL is struggling below $10.00 against the U.S. dollar. As of writing, SOL/USD is exchanging hands at $10.02, down 8.9% for the day. According to Coinmarketcap, the 24-hour trading volume rose more than 12% to $416,387,291.
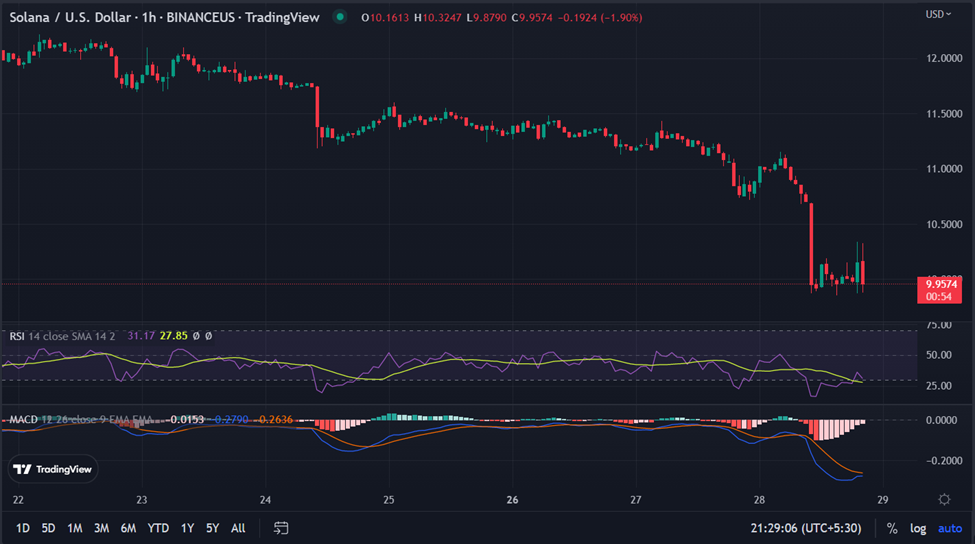
SOL took support around the low of $9.90. The formation of multiple Doji candlesticks suggests a bounce back toward $10.30. More buying opportunities could be seen toward $10.81 amid sustained buying opportunities. The hourly RSI holds in the oversold market structure, and another momentum oscillator MACD trades below the midline with receding bearish sentiment.
A shift in the bearish sentiment could drop the price and lower the daily loss. A target could be seen around $9.0.
Aptos forms an inverted hammer on a 4-hour chart
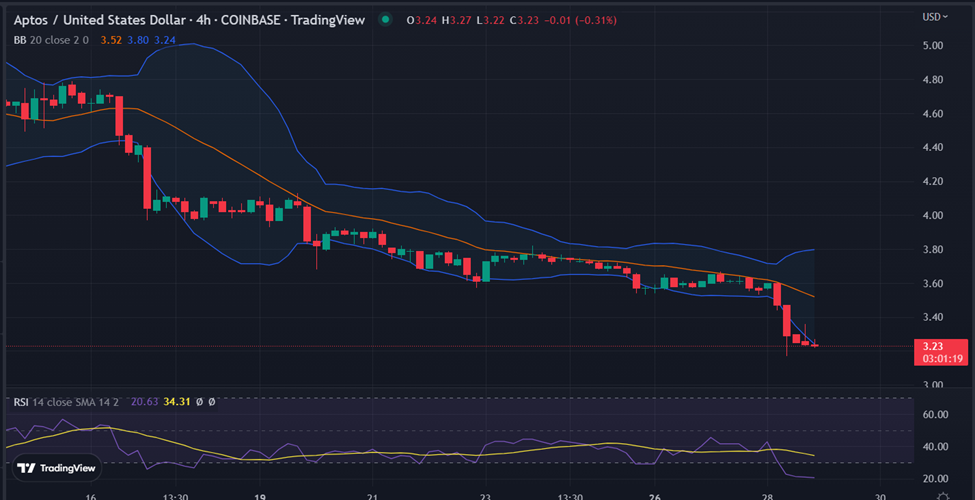
On the 4-hour chart, the APT/USD trades lower with modest losses. The Bollinger band, which tells the volatility expansion indicates the breakdown toward $3.23. The formation of the inverted hammer hints at a possible reversal toward $3.40. The RSI trades in the extreme oversold zone.
On the flip side, the token could test the yearly low below $3.00.
LDO advances toward $0.9730000
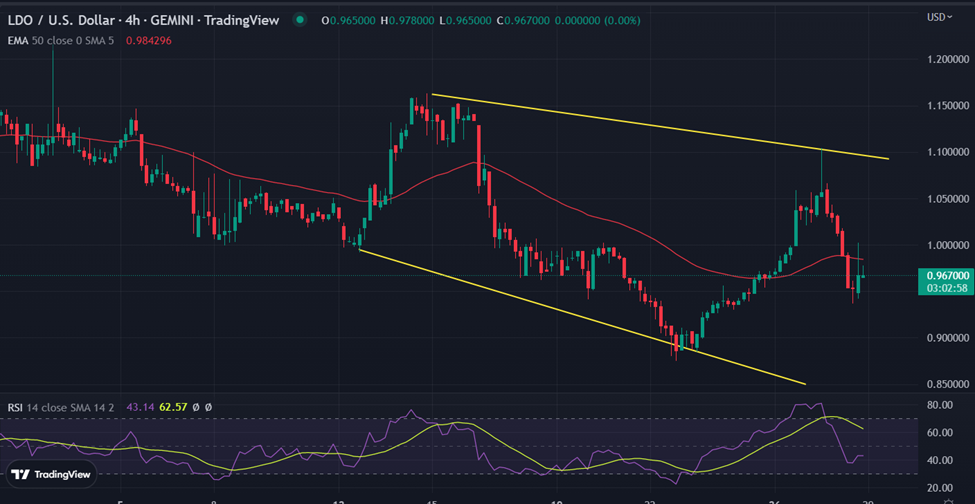
From the technical perspective, on the 4-hour chart, the LDO price struggles below the 50-day Exponential Moving Average (EMA). The price tested the low of $0.09370000. This coincides with the “Morning Star” pattern. A move above $0.9780000 would mean more gains in the token.
A horizontal resistance placed near $1.000000 could be ruptured if additional buyers could sense the buying opportunity. If that happens, the next upside target could be seen around $1.050000.
On the other hand, a break below $0.938015 could test the low of December 22 at $0.875000.


