
- Bitcoin remains bearish, potentially dropping to $55,000, as it continues to reject Bearish Order Blocks.
- Key resistance at $63,795, where a bullish reversal could occur, but until then, the bearish outlook dominates.
- Immediate support levels at $59,000 and $58,400, with minor rebounds possible around $60,800 before further decline.
Bitcoin’s recent price movement has been a topic of intense scrutiny among crypto enthusiasts and traders. As highlighted by Crypto Patel, an analyst, the cryptocurrency recently hit a Break of Structure (BOS), making a new low and perfectly rejecting the Bearish Order Block (OB).
The current trend remains bearish, with the potential for a drop to $55,000. This analysis suggests that the market is still bearish below the Change of Character (ChoCh) level, with a Break of Structure confirming this sentiment.

Subsequently, lower highs and lower lows confirm the bearish trend. The recent price activity shows each trough being lower than the previous one, reinforcing the downward movement. This pattern suggests that Bitcoin’s current bearish trend is likely to continue.
Order Blocks (OB) are regions of consolidation where large orders are believed to have been placed. A prominent order block exists around the $63,000 – $63,800 range. These blocks are essential for predicting price movements, as they often indicate areas where significant buying or selling activity will occur. Consequently, understanding these blocks can provide insights into future price action.
Fair Value Gaps (FVG) represent price ranges where the market experienced quick movements with little trading, suggesting an imbalance. The current chart highlights an FVG below the order block. This gap indicates that the market may correct itself to fill this imbalance, leading to potential price movements in the short term.
The Break of Structure (BOS) is a critical indicator of market sentiment. It signifies a change from bullish to bearish trends or vice versa. Recent BOS points indicate a bearish trend, reinforcing the overall negative sentiment in the market. This structural break suggests that traders should prepare for further downward movement.
The Change of Character (ChoCh) signifies potential market reversals. A ChoCh is marked at around $63,795, indicating that if the price breaks above this level, a bullish reversal may occur. However, until this level is breached, the bearish outlook remains dominant.
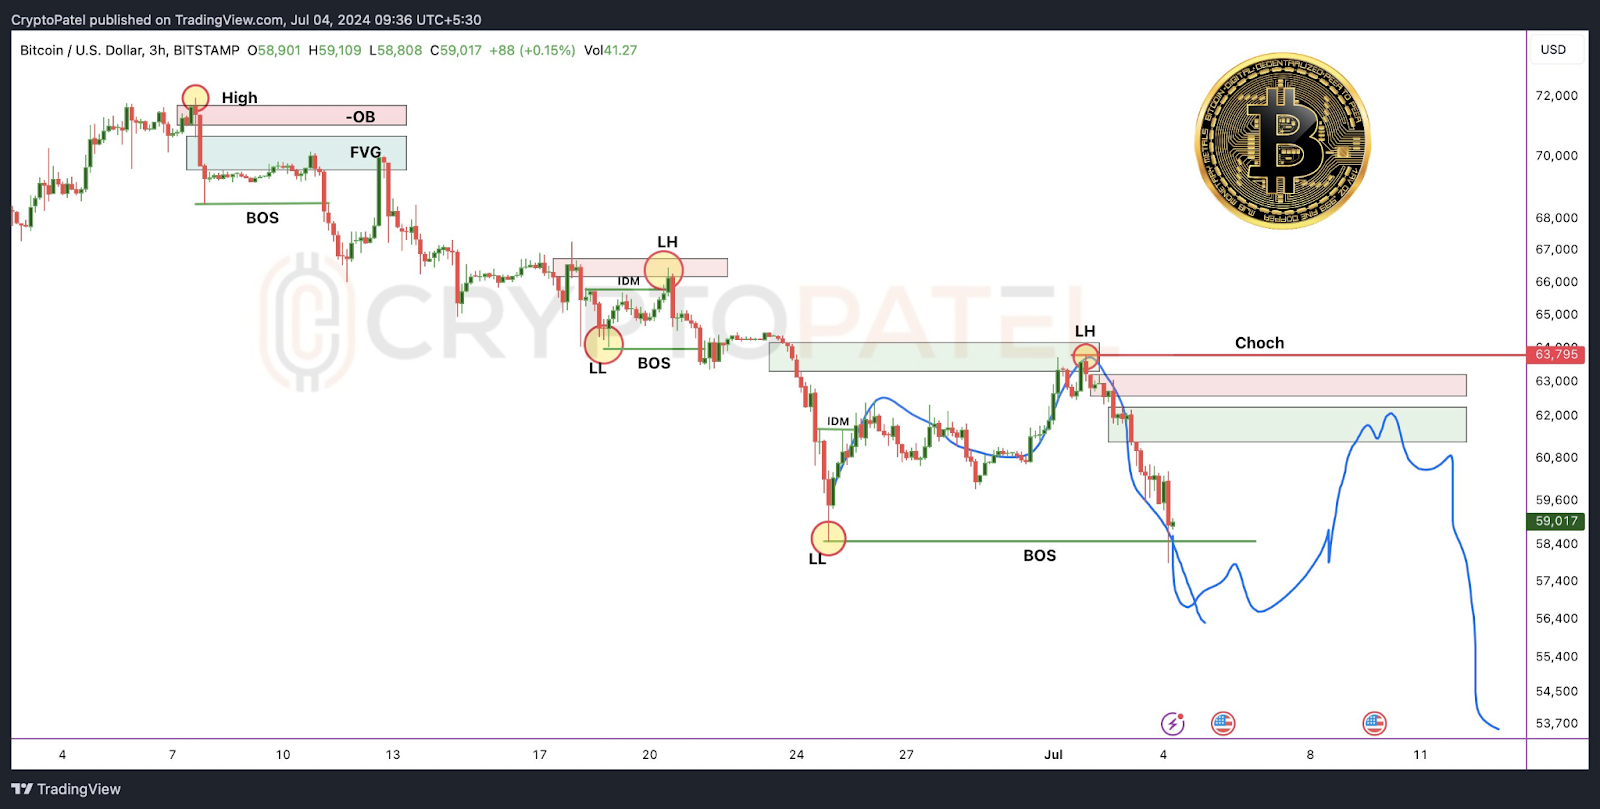
Immediate Demand (IDM) zones are areas where buying interest is expected to be strong, providing price support. Current IDM zones show where price action previously bounced back, indicating potential areas for future support. Understanding these zones helps in predicting where the market might find temporary relief from selling pressure.
Crypto Analysts Spot Bullish Signs in XRP Versus Bitcoin Trading PairPrice predictions suggest a minor rebound around $60,800 before a continued downward trend. Support is expected at around $58,400, which has acted as a recent low. Key support levels include $59,000 and $58,400, while significant resistance lies between $63,000 and $63,800.
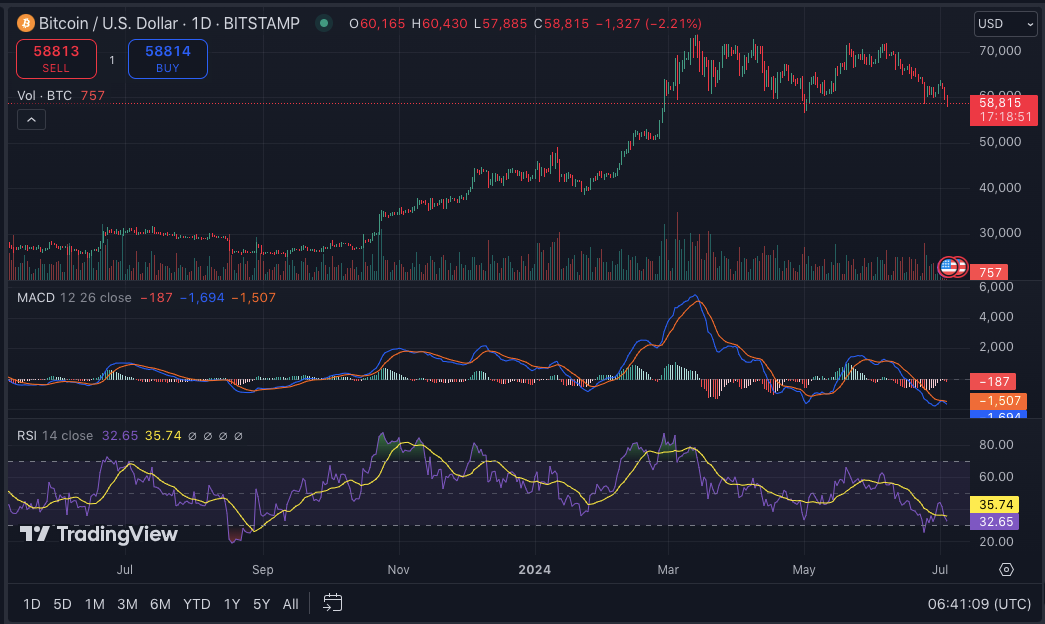
The overall trend remains bearish, with lower highs and lower lows indicating downward movement. At press time, Bitcoin price was $57,444.63, down 4% in the last 24 hours. The 1-day RSI reads 32.31, approaching oversold conditions. Additionally, the 1-day MACD trading below the signal line suggests further downward momentum in the short term.