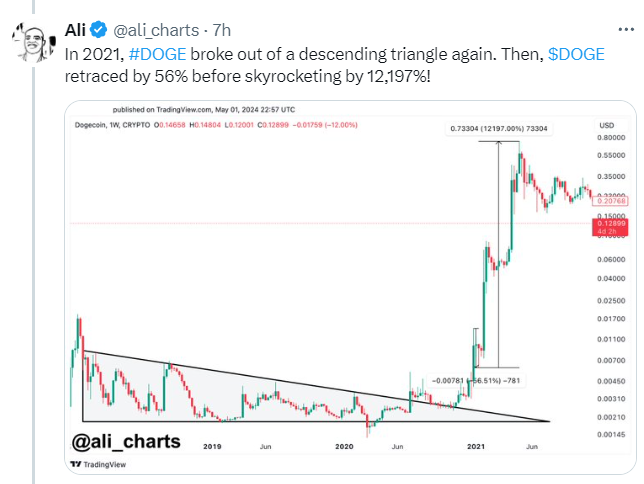
- Dogecoin exhibits a recurring pattern, and it recently broke out from a descending triangle as well as underwent a 47% correction.
- Historical patterns show Dogecoin experienced major gains after similar corrections in 2017 and 2021.
- Despite a recent decline in its price, Dogecoin maintains a robust market cap of approximately $18.17 billion.
Dogecoin (DOGE), the pioneer memecoin, has demonstrated notable price fluctuations reminiscent of its past market behaviors. Ali’s analysis delves into the currency’s current state compared to its historical performance during similar market phases.
Dogecoin has shown a tendency to undergo significant retracements following specific technical patterns, notably descending triangles, which have historically preceded substantial price surges. In 2017, following a breakout from a descending triangle, Dogecoin’s value decreased by 40% before it embarked on a 982% bull run. A similar pattern occurred in 2021 when it retraced by 56% after a breakout, only to soar by an astonishing 12,197%.

Currently, Dogecoin is manifesting a similar trend. It has recently broken out from another descending triangle and is experiencing a price correction of approximately 47%. This movement suggests a potential setup for another bullish phase, according to historical patterns.
As of the latest updates, Dogecoin is trading at a value of $0.1261, with a reported 24-hour trading volume of over $2.2 billion. Despite a decline of 3.58% in the last 24 hours and 16.60% over the past week, the digital currency holds a market capitalization of roughly $18.17 billion, maintaining a significant presence in the crypto market.
This recent performance places Dogecoin in a contrasting position relative to the broader cryptocurrency market, which has seen a lesser decline of 9.70% over the same period. Moreover, when compared to other Proof of Work (PoW) cryptocurrencies, which have remained relatively stable, Dogecoin appears to be underperforming.
The recurring pattern of breakout and correction in Dogecoin’s market activity might provide insights for market analysts and investors observing the cryptocurrency’s behavior. Understanding these cyclical movements could be crucial for predicting future trends and making informed decisions.


