


- Sustaining above $0.10 could push Dogecoin toward $0.15, testing key resistances.
- Dogecoin price nears critical support at $0.0952, aiming for a significant bounce.
- Technical indicators for DOGE show a slight bearish trend as the market struggles to recover.
Dogecoin is currently forming an intriguing setup on the daily chart, which could potentially signal a major shift in market direction. After months of downward pressure, the price action has formed a falling wedge pattern. This pattern, often recognized as a bullish reversal indicator, suggests that Dogecoin might prepare for a significant breakout.
According to analyst Ali Martinez, the key level to watch is $0.10. A sustained close above this mark could ignite a bullish rally, targeting $0.15 in the short term.
Imagine if, after all this craziness, #Dogecoin is the one to break out and kick off the next leg up… 👀
— Ali (@ali_charts) September 9, 2024
Watch out for this falling wedge on the $DOGE daily chart — a sustained close above $0.10 could spark a bullish run to $0.15! pic.twitter.com/oGIeR3yHtF
The falling wedge is identified by converging trend lines connecting lower and lower highs. This contraction of price movement often indicates the exhaustion of selling pressure, leading to a potential upward breakout.
For Dogecoin, the upper boundary of this wedge acts as immediate resistance. The price needs to decisively break above this line to confirm the bullish reversal. Once the breakout occurs, Dogecoin could aim for the Fibonacci retracement levels, which are critical in determining potential targets.
Dogecoin is trading around $0.097, with support testing near $0.0952. If this level holds, it would reinforce the strength of the falling wedge pattern. A bounce from this support could see Dogecoin rally towards key resistance levels.
The first significant target is $0.1536, which aligns with the 61.8% Fibonacci retracement level. Beyond that, the next resistance lies at $0.1831, marking the 78.6% retracement. Ultimately, if bullish momentum accelerates, the price may even test the $0.2290 zone, a critical long-term resistance level.
Dogecoin Targets $0.3: Will DOGE Breaks Out of Wedge PatternIf Dogecoin fails to hold the $0.0952 support level, it could trigger further declines. The next line of defense would be the $0.0805 level, a previous support zone that could prevent a deeper correction.
As of the reporting time, the Dogecoin price hovered at $0.09856, marking a 2.74% increase over the past day. The meme-based cryptocurrency showed a significant trading volume of $470.04 million in the last 24 hours, an uptick of 24.51%.
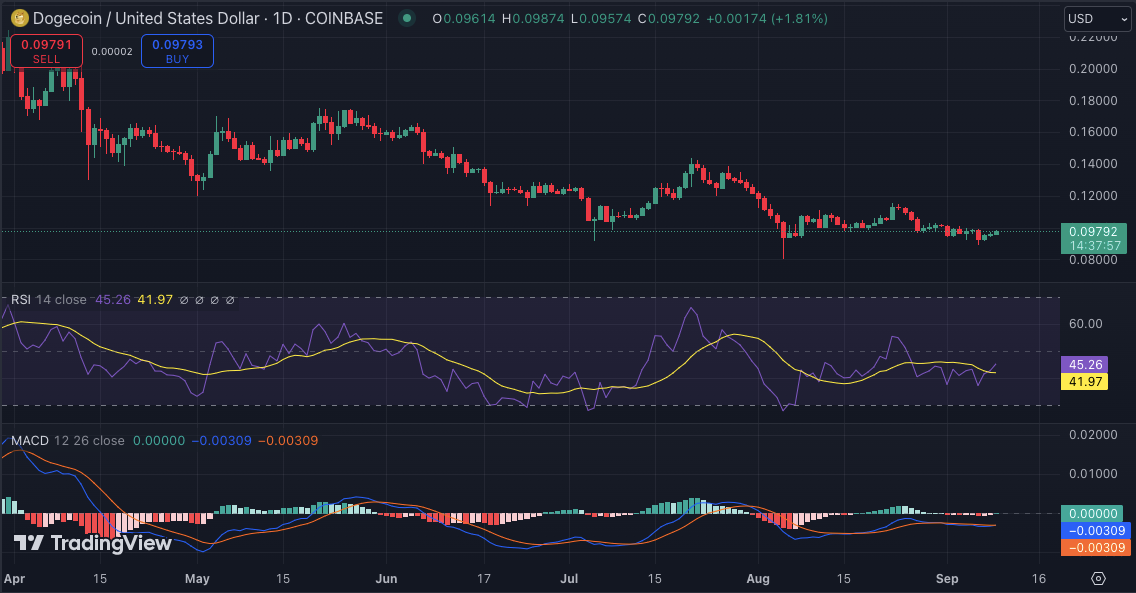
The daily technical indicators for Dogecoin suggest a cautious market sentiment. The Relative Strength Index (RSI) stands at 45, indicating a neutral momentum. Concurrently, the Moving Average Convergence Divergence (MACD) hovers near the zero line, with a slight downward trajectory, reflecting minimal momentum and potentially stagnant market conditions.
In conclusion, Dogecoin’s current price action and formation of a falling wedge pattern offer a pivotal moment for investors and traders alike. The ability to sustain support at $0.0952 and potentially break above the $0.10 resistance level could set the stage for a bullish rally toward $0.15. However, the market’s response to these technical levels will be critical.


