- Nebraskangooner observes a stable rise in DXY, predicting continued upward momentum.
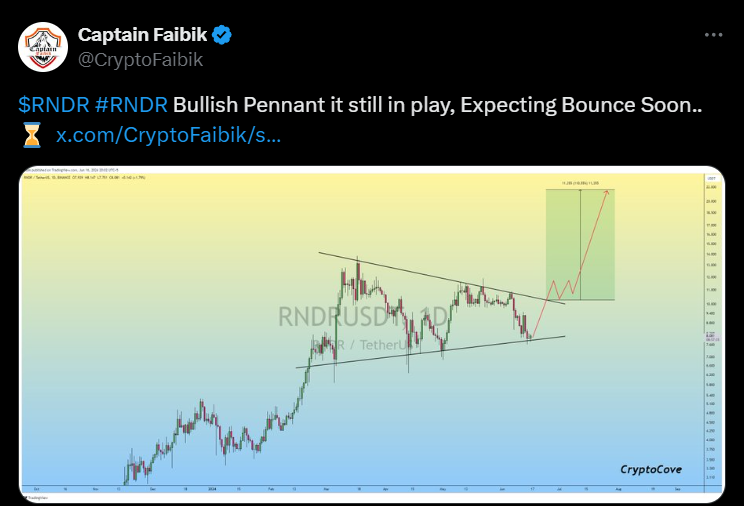
- Captain Faibik anticipates a 110.5% increase in RNDR value, noting a bullish trend.
- The U.S. Dollar Index climbs with a bullish weekly candle, indicating strong market confidence.
According to the latest chart analysis by Nebraskangooner, the U.S. Dollar Index (DXY) is currently demonstrating a stable upward trajectory. The index recorded a slight increase, registering at $105, a minor gain of +0.02%. The chart features a clear upward trendline indicating potential future growth in the value of the U.S. dollar against a basket of major currencies.
This analysis is visually supported by a series of candlestick formations over recent weeks and various technical indicators that suggest a continued bullish sentiment in the market. Key resistance and support levels are also highlighted, with the index recently breaching a significant resistance point, suggesting potential for further gains.
DXY has recently reclaimed a significant position following a robust weekly candle, which signifies a bullish trend. Analysts observe that despite previous setbacks, the strength demonstrated in this week’s performance suggests a potential upward trajectory. The DXY’s recovery is particularly notable in the context of its past fluctuations, highlighting resilience and a possible shift in investor sentiment
Render (RNDR) is poised for a major breakthrough, according to an analysis from crypto analyst Captain Faibik. Based on analysts’ comprehensive technical chart, Render Token shows a bullish trend with a potential of 110.55%. The chart features a descending triangle pattern, which is a bullish sign in technical analysis.
Analysts Predict RNDR’s Surge to $100 in Bull Market BoomThe RNDR price has consolidated recently, now verging on breaking through a repeatedly tested resistance line. If this barrier is overcome, the market could see a rapid price escalation. Captain Faibik’s forecast, which outlines a bold rise in the asset’s value, is visually represented on the chart by an upward trajectory marking future expectations.

The candlestick chart spans from October 2023 to June 2024, illustrating a notable uptrend that started in early 2024. The pattern indicates a consolidation phase after the initial rise, with the bullish target set in a higher price zone marked by a green rectangle. According to the analysis, RNDR could climb to around $22.
This detailed chart indicates a strong buying sentiment and suggests that Render Token might soon experience significant growth. This outlook will likely attract investors eager to capitalize on the promising developments in the Render Token market trajectory. At the time of writing, the Render price is trading at $7.67, with a slight decrease of 3% over the past 24 hours.


