


DYDX falls by 7% in the past 24 hours after the conclusion of the security staking module. The total amount withdrawn from the staking pool, 19,765,085 $DYDX ($26M), accounts for 30% of its circulating supply (65,569,295). This high volume of sell-offs is likely to create bearish pressure on DYDX prices in the near future. Investors should monitor DYDX closely as it may be a good opportunity to capitalize on potential retracement opportunities.
DYDX is trading at $1.30 after opening the daily trading session at $1.45 and reaching a high of $1.50, before closing the session virtually unchanged from where it opened. Although the price has been relatively range-bound over the past few weeks, with the trading volume totaling to $54,443,380.
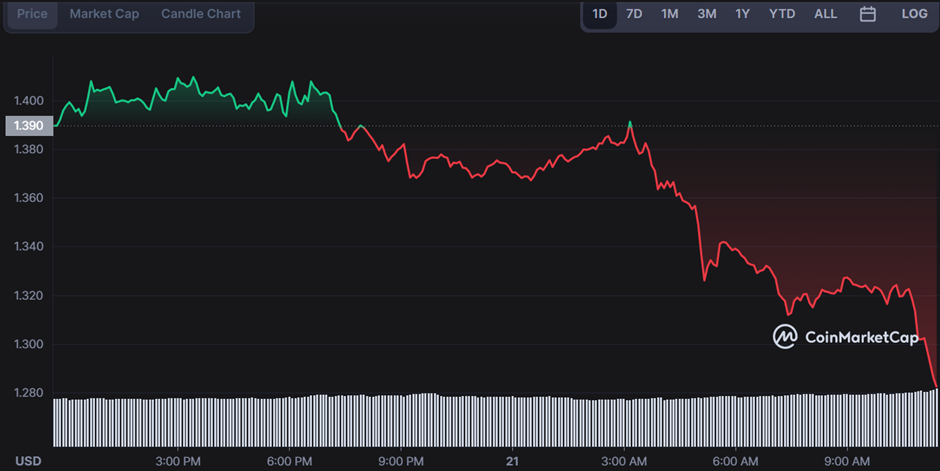
DYDX’s price chart indicates that the downward trend is likely to continue, but investors shouldn’t forget that this could also represent a buying opportunity if they can identify bottom levels.
DYDX Technical Analysis
DYDX price analysis shows the digital asset is trading in a descending triangle pattern which could lead to a strong bearish move in the coming weeks. The MACD and RSI are both pointing downwards, signaling a continuation of the bearish momentum.
With the recent sell-offs, DYDX is likely to enter a period of consolidation before it can resume its uptrend. The Fibonacci Retracement levels indicate that DYDX could find support at the 0.382 level or even lower.
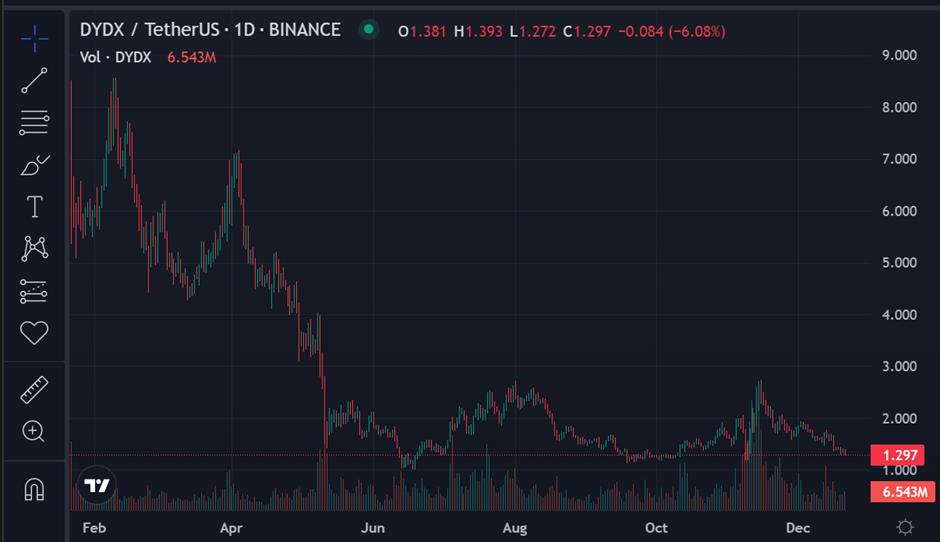
Further technical indications show the digital asset is forming a bear flag pattern, which implies an impending bearish move in the near future. The Stochastic RSI is also showing bearish divergence and this could be a signal for investors to look out for further retracements.
Conclusion
In conclusion, the recent withdrawal from the security staking pool has put DYDX at risk of a bearish retracement. The key support levels to watch are the 0.382 Fibonacci Retracement and the bear flag pattern which could provide a good entry point for investors looking to capitalize on potential retracement opportunities.


