


- Ethereum’s trading volume surges, hinting at potential volatility as it approaches the crucial $3,000 support level.
- Bearish trends push Ethereum below $3,000; breaking $3,050 resistance is crucial for reversing the momentum.
- Technical indicators show Ethereum in a neutral position, with RSI at 47.12, hinting at potential price movement.
Ethereum (ETH) is once again nearing a critical support level, raising questions about whether a surge in demand will follow. IntoTheBlock data indicate that historically the $3,000 mark has been a significant point for Ethereum, with over 1.7 million addresses acquiring ETH just below this level. As the price dips below this key threshold, market watchers are keenly observing for potential shifts in buying interest.
At press time, Ethereum is trading at $2,979.39, reflecting a 5.16% decline in just one day. The market capitalization stands at $358.29 billion, down 5.18%, while the 24-hour trading volume has surged by 21.24% to reach $22.07 billion. This increase in volume suggests heightened trading activity and volatility as Ethereum navigates this crucial price zone.
The recent price trend shows a significant decline from a starting point of approximately $3,142. After peaking early in the day, Ethereum experienced a sharp drop, reaching a low around $2,950. Although the price has rebounded slightly to $2,979, it remains below the important $3,000 level. This movement indicates bearish pressure, and the market’s next moves will be closely watched.
Ethereum faces several key resistance levels that could impact its price trajectory. The $3,050 level, where recent selling pressure increased, presents immediate resistance. If Ethereum manages to break through this level, it could test the stronger resistance at $3,142, the day’s peak. These resistance levels are crucial as they may determine whether Ethereum can regain upward momentum.
Breaking Down Ethereum’s Recent Dip: Will $2,825 Support Hold?On the support side, the $2,950 level marks the recent low where buying interest emerged. This immediate support could play a vital role in preventing further declines. If selling pressure persists, the price may test the psychological support level at $2,900.
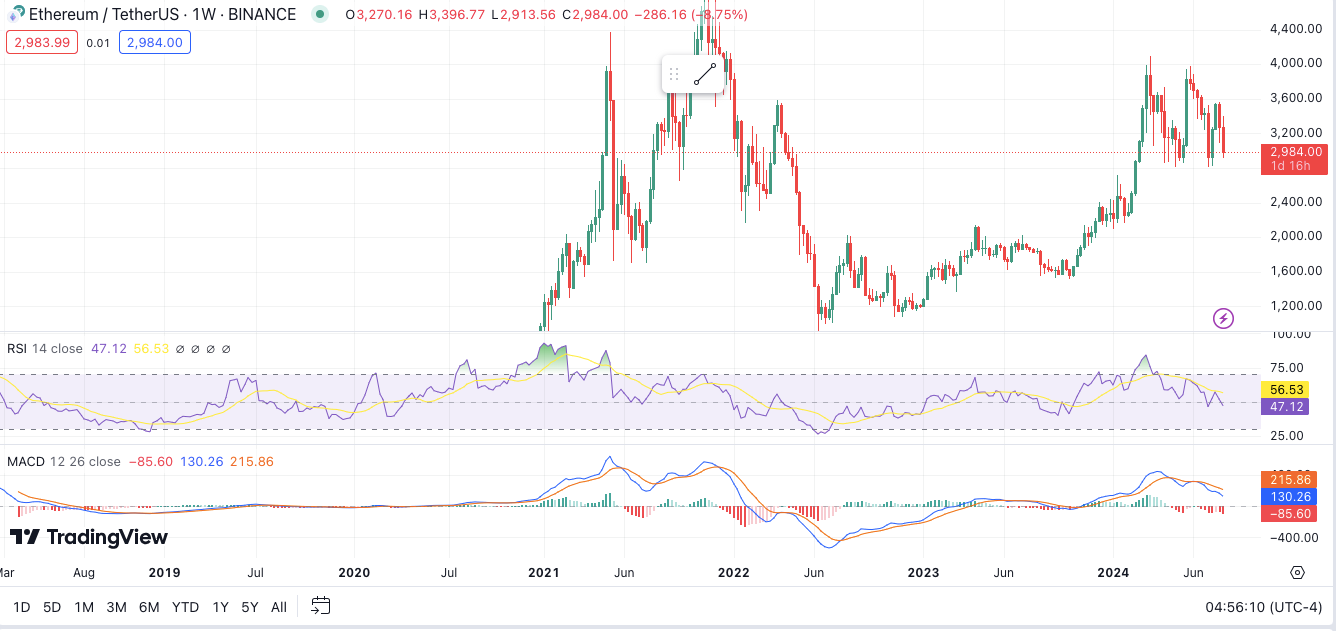
Technical indicators provide additional insights into Ethereum’s current state. The 1-week Relative Strength Index (RSI) reads 47.12, suggesting that Ethereum is in a neutral position. This means it is neither overbought nor oversold, leaving room for potential movement in either direction. The 1-week Moving Average Convergence Divergence (MACD) is trading below the signal line, indicating some downward pressure on the price in the short term.


