
Ethereum is currently experiencing notable market movements. Crypto analyst VellaCryptoX recently pinpointed a specific bidding zone for Ethereum, ranging between $3,175 and $3,130. This strategic area is pivotal as the cryptocurrency gears up to challenge a key resistance point.
As Ethereum hovers around these levels, it encounters substantial resistance at about $3,900. This resistance, marked in blue on financial charts, is a crucial barrier that could dictate the asset’s short-term price trajectory. Ethereum might set the stage for further gains if it breaks past this hurdle.
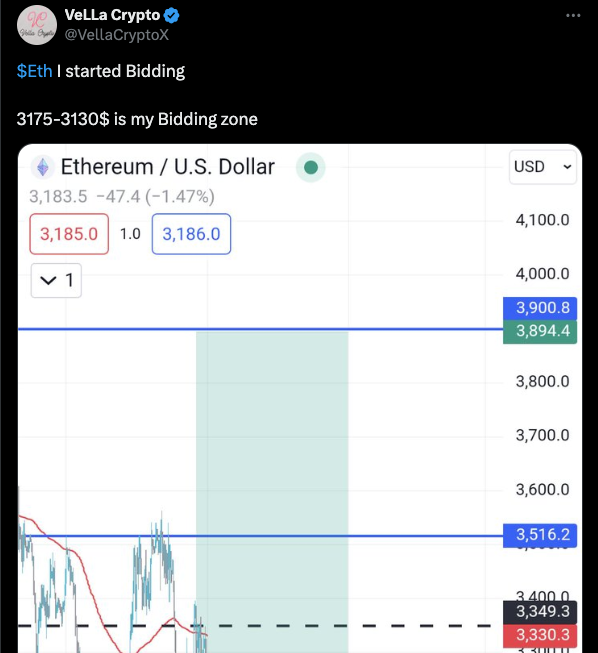
However, the downside risks remain significant. Immediate support for Ethereum lies around $3,330, delineated by a dashed line on the chart. A dip below this support level could push the price toward the $2,985 zone, intensifying bearish sentiments among investors. Such a movement would be critical, possibly setting a new tone for Ethereum’s market dynamics.
Adding to the complexity, technical indicators reveal a bearish outlook in the near term. The red moving average has recently crossed below the price candlesticks signaling that bearish pressure might continue influencing Ethereum’s price actions.
Ethereum price has seen a significant pullback, trading at $3,171.08 at press time, marking a decline of 4.55% over the past day. The decrease comes amid a broader sell-off in the cryptocurrency market, which has also seen other major coins experiencing declines. The 24-hour trading volume has increased 34.67% within the last 24 hours, totaling $18,608,194,131. The volume-to-market cap ratio stands at 4.88%, indicating significant liquidity and active trading compared to the overall market size.
Bearish Trend or Temporary Relief? Decoding Ethereum’s Latest Price ActionDespite the day’s losses, Ethereum maintains a robust market capitalization of $381,327,069,260. The price chart for the past 24 hours shows a downward trend, starting from a high of around $3,324, with a steep decline occurring during the latter half of the day.

The daily technical indicators for Ethereum show a downward trend, as observed in the chart. The Moving Average Convergence Divergence (MACD) is trending negatively, with a value of -8.06, suggesting that the short-term momentum is weaker than the long-term trend. The Relative Strength Index (RSI) stands at 41.41, indicating that Ethereum is approaching oversold.