


- Ethereum sees a 3% rise in addresses holding 10,000+ ETH.
- The current support level of Ethereum revels that it must hold $3152 support for a potential rise to $4000
- A breakout from the $4000 level could lead to $6000-$7000 range.
Ethereum is showing strong signals of increasing buying pressure. Over the last three weeks, there has been a 3% rise in the number of addresses holding 10,000 ETH or more, as highlighted by Ali Martinez, a top analyst.
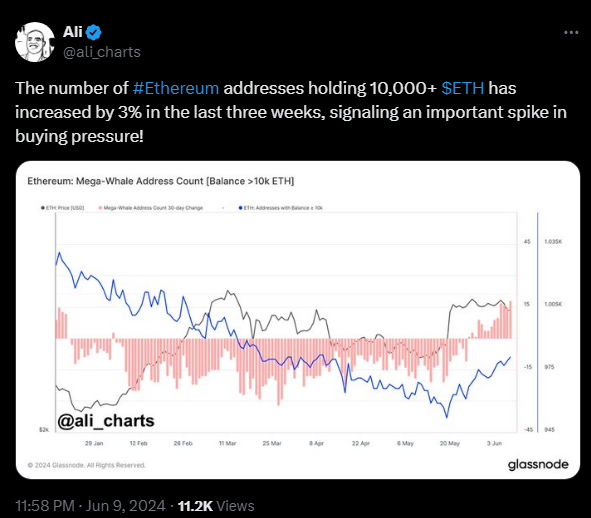
At present, Ethereum (ETH) is trading within a bull flag or parallel channel. It is a pattern that traders often interpret as a sign of a potential breakout.
Analyst Predicts Ethereum’s 13x Surge Based on Previous Cycle PatternsRenowned trader Crypto Patel has shared insights on two possible moves of Ethereum; one is bearish, and the other is bullish. The bearish scenario presents a potential decline if Ethereum fails to cling to the support level at $3650. A breakdown below this level could lead to a further decline up to $3152. He made this analysis by citing the last Fair Value Gap (FVG) in the price action analysis.
Conversely, if Ethereum maintained the $3152 support level, it could brim towards $4000. He also stressed that if the resistance at $4000 was breached then the ETH could touch a new high somewhere between $6000 and $7000 range.
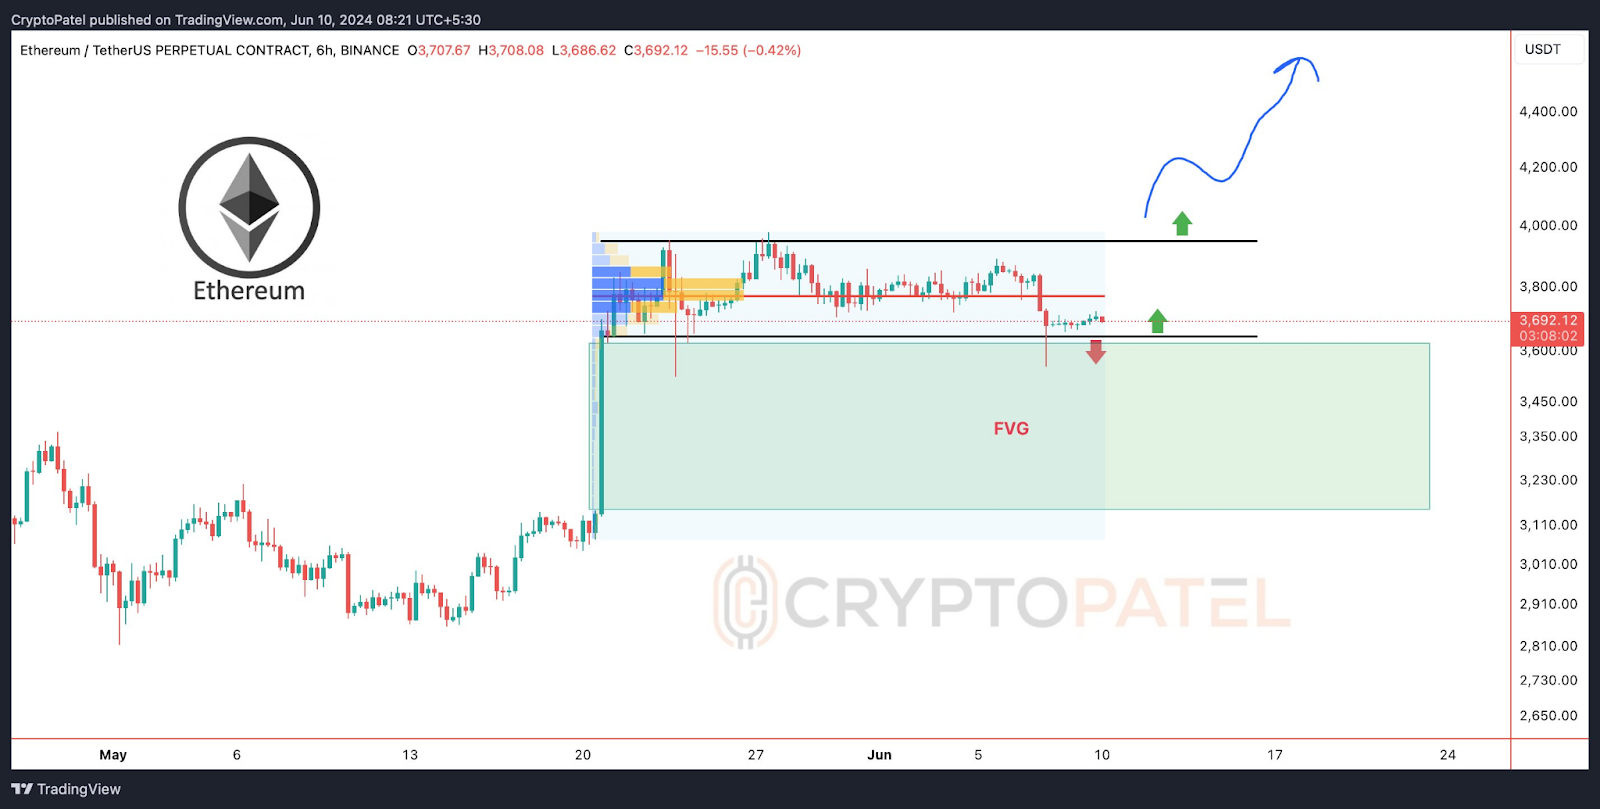
Based on the data, it is clear that there is an increase in buying pressure. If the buying pressure was potential enough to break through the resistance, investors and traders could enjoy the bullish rally of ETH.
Ethereum Price
At press time, Ethereum is priced at $3686.23, reflecting a slight 0.19% increase over the last day. However, trading volume over the past 24 hours has decreased by 9.23%, totaling $7,973,807,104. This reduction in trading activity suggests a momentary lull in market participation.
Despite this, Ethereum’s market cap has risen by 0.35% to $442,916,160,155, indicating a slight increase in overall market valuation. The Volume/Market Cap Ratio stands at 1.80%, which suggests a relatively moderate level of trading volume compared to the market cap.
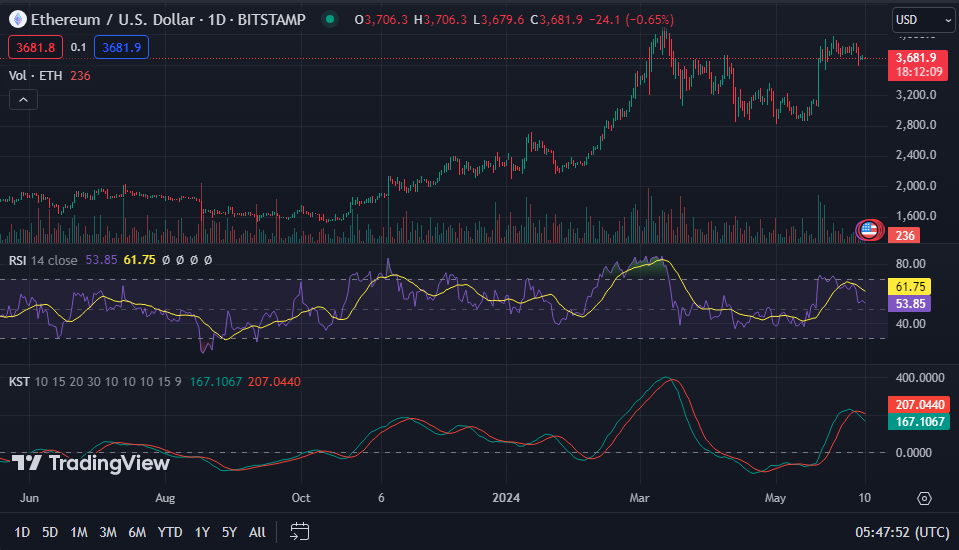
From a technical analysis perspective, the 1-day price chart reads 54.12. Although there is a slight decrease compared to the previous day, the 1-day MACD trading below the signal line indicates a bearish signal for Ethereum in the short term. Additionally, the 1-day KST trading above the zero line suggests potential further downward movement in Ethereum’s price in the near future.


