


- Ethereum’s ascending triangle signals a potential rally, targeting the $1,800 – $1,900 range.
- Robust market capitalization and high trading volume highlight Ethereum’s strength.
- The $1,600 support level is critical as Ethereum’s bullish momentum gains momentum.
In the world of cryptocurrency, Ethereum (ETH) is currently in the spotlight as it exhibits signs of a potential resurgence. A close examination of Ethereum’s 3-day chart reveals an intriguing pattern—a bullish ascending triangle. This formation suggests the possibility of an ETH price rally to levels between $1,800 and $1,900, and the crypto community is closely watching these developments.
A cryptocurrency analyst, Ali, shared a Twitter post providing insights on the current Ethereum price movement.
#Ethereum is poised for a rebound off the hypotenuse of an ascending triangle spotted on the 3-day chart. A firm close above the 18SMA could propel $ETH to $1,800 – $1,900.
— Ali (@ali_charts) October 20, 2023
You can try this trading strategy at @PrimeXBT. Use the promo code alicharts and register here:… pic.twitter.com/zT8KOS6nkE
Ethereum, known for its decentralized open-source blockchain and Ether cryptocurrency, has recently faced challenges. ETH/USD has largely traded below the $1,600 support level recently, with bears taking control following a break below the 18SMA (Simple Moving Average). However, the tides are turning, with today’s data painting a different picture.
The ascending triangle, a bullish chart pattern, emerges as a series of higher lows alongside relatively equal highs, indicating an impending upward breakout. If this bullish momentum persists, Ethereum could breach the triangle’s upper boundary and reach the coveted $1,800 – $1,900 range. Historically, this price range has served as a formidable resistance level for ETH, and a breakthrough could trigger further price gains.
To navigate potential downside scenarios, investors are closely monitoring the 18SMA, which now acts as a crucial support level. A breach below this level could exert additional downward pressure, with $1,500 emerging as a significant support zone. The current market capitalization for Ethereum stands at over $195 billion, securing its position as the second-largest cryptocurrency by market cap. A robust 24-hour trading volume of $6.75 billion reflects strong interest from traders and investors, signaling a vibrant market.
At the time of this report, ETH is trading at $1,617, reflecting a 24-hour surge of 5%. The optimism and bullish momentum in the market appear set to continue as more users and developers enter the Ethereum ecosystem. Notably, ETH touched an intraday high of $1,628, now serving as a critical resistance level.
The daily technical outlook for ETH/USD remains bullish, with 50-EMA and 20-EMA both showing a positive crossover. The 50-EMA is currently above the 20-EMA, indicating a strong bullish bias. The Relative strength index (RSI) also signals bullish momentum, with a reading of 68 at the time of writing, and if bullish momentum continues, RSI might enter the overbought territory.
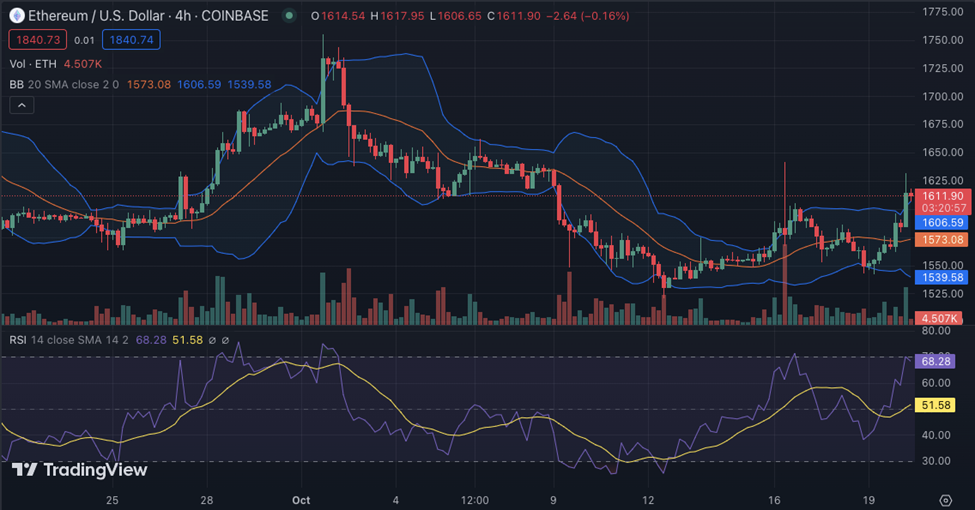
The Bollinger bands on the 4-hour chart also show bullish signals, with both bands widening and moving toward the upside. The upper band is currently at $1,611 and could act as a key resistance level in the short term. On the downside, the lower band at $1,539 would act as a crucial support level. The moving averages suggest that the trend for ETH/USD is likely to continue upward.
In conclusion, Ethereum’s 3-day chart is flashing signals of a potential revival, with the ascending triangle pattern hinting at a bullish breakout. As the crypto market continues to evolve, Ethereum’s performance remains a topic of interest for investors and enthusiasts alike, with the possibility of ETH surging to $1,800 – $1,900.


