
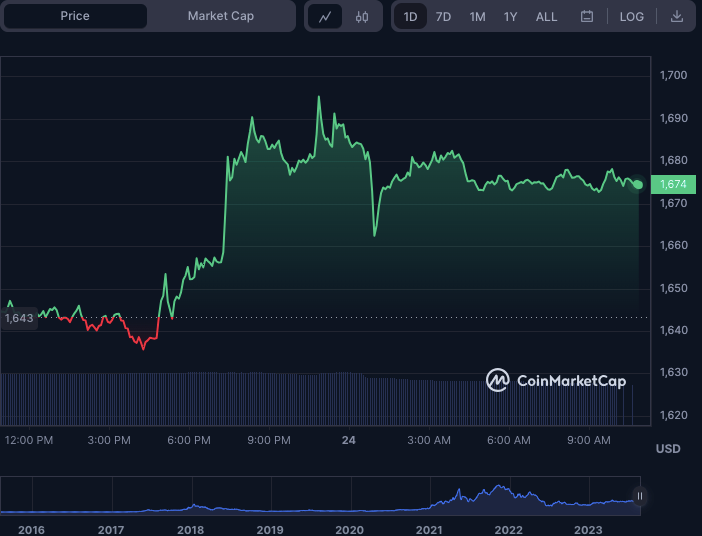
- Ethereum’s price is currently stabilised above the $1,650 support level.
- The crucial resistance level to watch is $1,700 for potential bullish momentum.
- Bitcoin’s ongoing recovery could positively influence Ethereum’s market behaviour.
Ethereum, the second-largest cryptocurrency by market capitalisation, shows signs of a potential upward trajectory. Over the past week, the digital asset has faced downward pressure, but recent market activities suggest a possible change in tide. At present, the ETH price is at $1,674, marking a 1.66% increase in the last 24 hours. The green candlestick patterns on the charts further emphasise the bullish sentiment surrounding the cryptocurrency.
The 24-hour trading volume for the cryptocurrency is at $6,565,201,400, indicating more than average trading. Meanwhile, the market capitalisation of Ethereum stands at $201,556,596,166, with a 24-hour surge of 1.66% as of writing, making it the second-largest cryptocurrency after Bitcoin. The circulating supply of the Ethereum blockchain is at 120,214,162 ETH tokens.
ETH/USD token has been trading in a range of $1,634 and $1,696 in the past 24-hour period, which clearly indicates the prevailing positive sentiment in the crypto sphere. The immediate support levels for Ethereum stand at $1,650 and $1,660i. If the Bears make a comeback, then ETH price could decline towards the $1,600 and $1,550 support levels, which could lead to further losses.
The key resistance level that Ethereum has been grappling with is $1,700, a threshold it hasn’t managed to surpass in recent days. If Ethereum does break this level, it could signal the start of a bullish trend, offering a prime trading opportunity. This breakthrough could pave the way for Ethereum to target higher price points, such as $1,800 and $1,900.
Meanwhile, Bitcoin’s ongoing recovery could catalyse Ethereum’s potential upward momentum. Currently, BTC is trading at $26,506 and has seen a 1.66% increase in the past 24 hours. If Bitcoin sustains this positive trajectory, it could bolster Ethereum’s chances of breaking the $1,700 resistance and positively impact the broader cryptocurrency market, lending additional credibility and bullish sentiment to other digital assets.
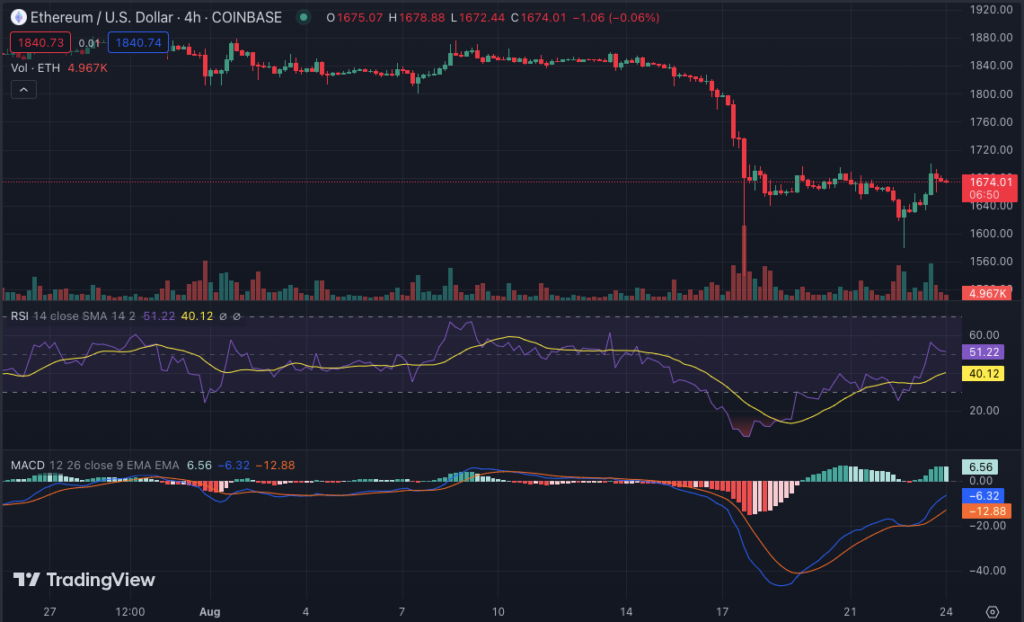
The latest technical indicators outlook suggests that Ethereum could possibly be preparing for a bull run. The 20-EMA is currently above the 50-EMA, and MACD is also in bullish territory. The moving average convergence divergence indicator also suggests a bullish trend in the charts. The MACD line is above the signal line, and the histogram is increasing in value. The Relative Strength Index (RSI) also shows that ETH is currently in a bullish position. The RSI is above the 50 level at 51.22 and shows a steady value increase.
To conclude, Ethereum’s price is currently in a bullish trend, with buyers dominating the market. If Ethereum is able to break above the $1,700 resistance level, then there is potential for a bullish liftoff that could take ETH prices toward new highs. On the downside, if bears make a comeback, then $1,600 and $1,550 are the next important support levels. The technical indicators also suggest that Ethereum could be ready for an uptrend.