


- Ethereum’s daily active users have halved since 2021, challenging perceptions of its growth and utility in crypto.
- Support between $2,324 and $2,651 is crucial for sustaining the bullish outlook and avoiding a trend reversal.
- Remaining above the $2,324 support could propel Ethereum towards unprecedented highs, targeting the $8,000 to $12,000 range.
Ethereum (ETH) has recently demonstrated patterns on its price chart that suggest a strategic point of analysis for investors and traders alike. The latest data, marked in yellow on the chart, indicates the completion of another 5-wave pattern, originating from the low point at January’s end. This development signals a critical juncture, urging market participants to be cautious in anticipation of a possible wave 2 retracement.
The forthcoming section might witness a modest pullback, with the support levels identified between $2,324 and $2,651. A decisive fall below $2,877 would be necessary to confirm that the current upward momentum has peaked. Morecryptoonline’s technical and Elliott Wave analysis of cryptocurrency charts provided the current Ethereum price analysis.
The observed price movement on Ethereum’s chart is emblematic of the cryptocurrency’s volatile nature and its opportunities for astute market analysis. If the price maintains its position above the established support level of $2,324, it paves the way for potentially lucrative returns.
The prospect of Ethereum’s upward trajectory towards the $8,000 to $12,000 range remains contingent upon its performance relative to the identified support zones. A dip below the yellow-marked support area could still be interpreted through a bullish lens, albeit with a revised understanding of the chart’s structure.
Fred Krueger, a crypto investor, shared an analysis pointing out that Ethereum’s use case and direct engagement have diminished. Yet, investors continue to drive its market capitalization upwards, likening its current state to a “meme coin” similar to Shiba Inu. This situation has sparked a dialogue regarding Ethereum’s intrinsic value, especially in a market teeming with more efficient and cost-effective blockchain technologies.
Furthermore, regulatory hurdles, particularly skepticism from SEC Chairman Gary Gensler regarding approving an Ethereum ETF, add another layer of uncertainty. Krueger’s skepticism about Ethereum’s future, especially in regulatory terms, highlights the complexities of cryptocurrency investments and the importance of regulatory acceptance for the sustainability and growth of digital assets.
ETH has embarked on an impressive climb within a rising channel since the dawn of 2024, marking a notable journey upward. The price of Ethereum has recently surpassed a crucial barrier, edging over the $2,900 resistance mark. ETH is currently valued at $2,965, with a daily increase exceeding 1%.
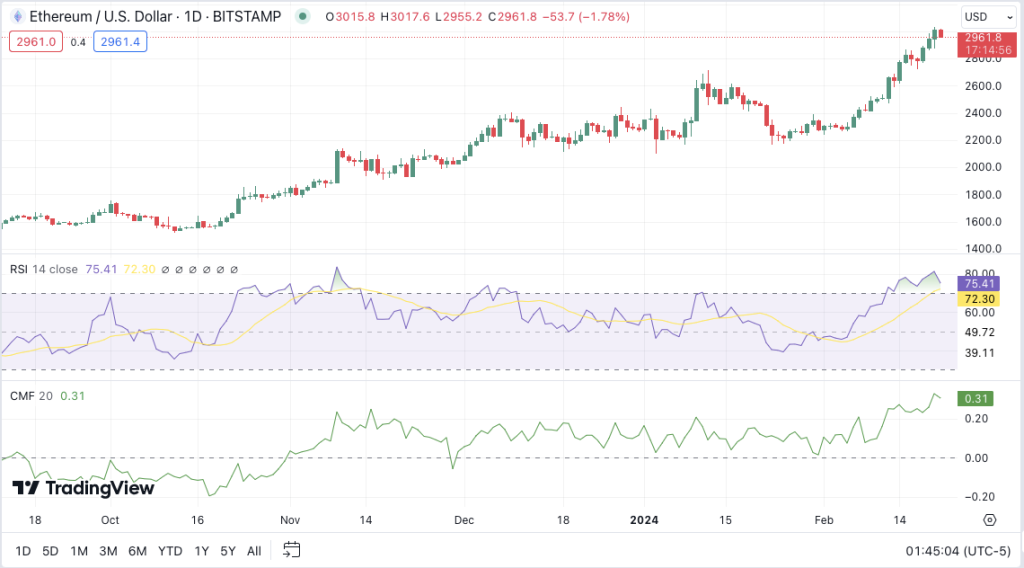
The market’s equilibrium is hinted at by the Relative Strength Index (RSI), which is hovering around the 75 mark, indicating an overbought market The Moving Average Convergence Divergence (MACD) indicator, where the MACD line has crossed above the signal line, indicates bullish momentum. Additionally, the Chaikin Money Flow (CMF) indicator positions itself at 0.31, firmly in the green zone, which aligns with a positive outlook for Ethereum in the marketplace.


