


- Ethereum’s current setup mirrors Bitcoin’s 2020 cycle, suggesting potential for substantial future growth.
- BlackRock’s daily $100M ETH purchases and reduced Grayscale selling pressure indicate strong institutional confidence.
- With Ethereum’s 1-week RSI at 47.14 and MACD below the signal line, expect potential volatility and market movement.
Ethereum ($ETH) is trading at $2,985.60 at press time, facing a challenging market. With a 24-hour trading volume of $21,998,525,787, Ethereum has experienced a decline of 5.26% recently. Despite this downturn, Ethereum’s present setup presents intriguing opportunities for investors, reminiscent of Bitcoin’s 2020 cycle.
As per analysis by Crypto Tony, an analyst, Ethereum is in a notable downtrend. After peaking in early May, the price has been on a downward trajectory. This pattern reveals decreasing highs and lows, suggesting persistent bearish momentum.
In this volatile period, the price has encountered resistance at several key levels. Notably, the $3,440 mark has acted as a resistance zone, where the price faced multiple rejections in July. Additionally, the $3,600 level has also been a point of contention, reflecting previous peaks and troughs observed from June to July.
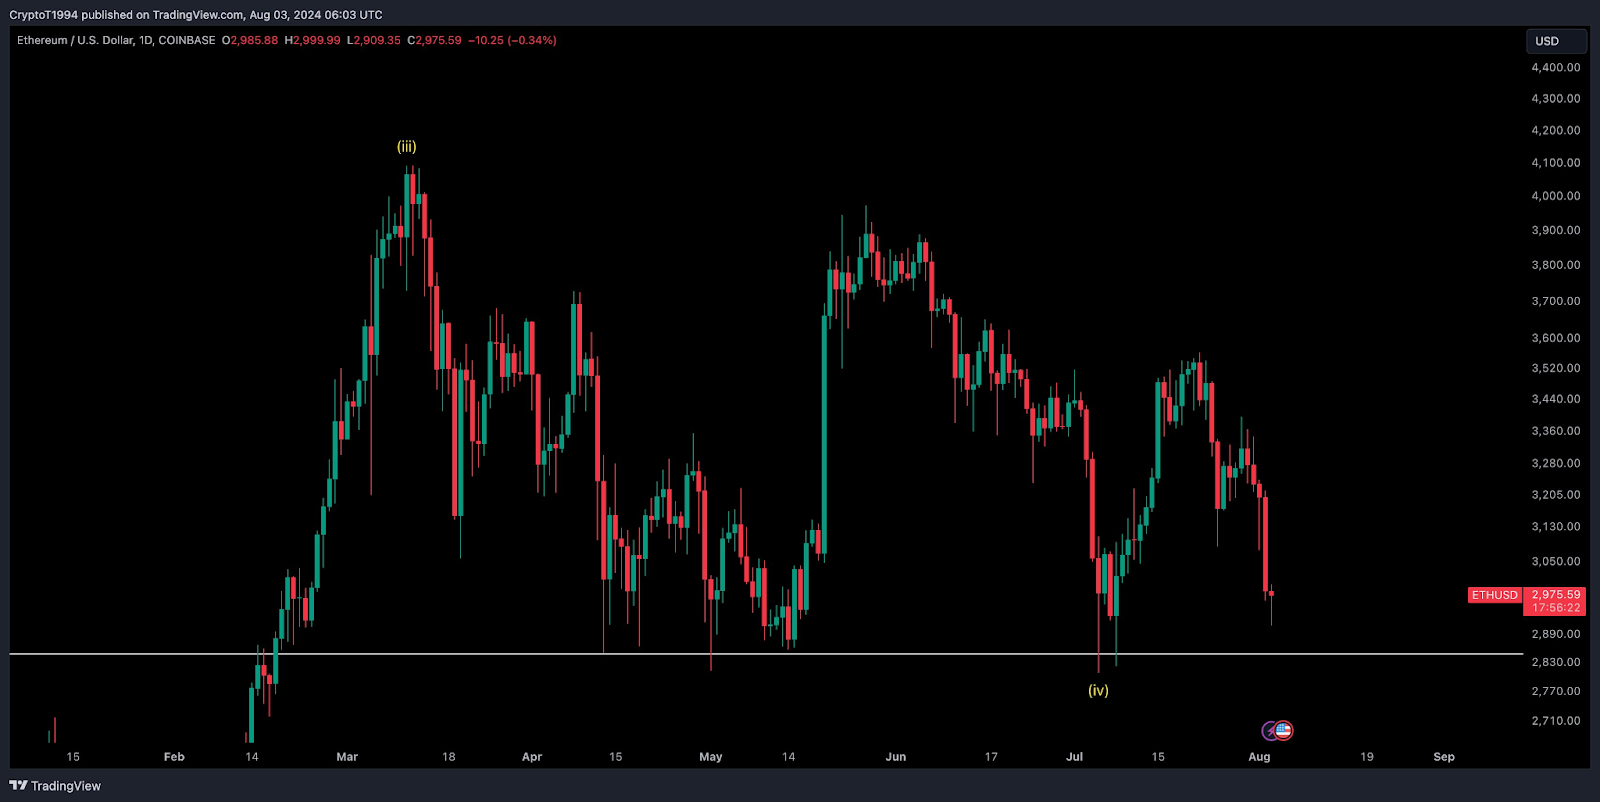
On the flip side, the support levels are drawing attention. The immediate support stands around $2,770. This level corresponds to recent lows seen in late July, where the price may stabilize if the downtrend persists. Beneath this, another significant support level is around $2,710. This level aligns with historical lows, though not fully visible on the current chart, it is suggested by the visible axis.
In contrast to the bearish trend, there are compelling reasons to be optimistic about Ethereum’s future. Further noted by TedPillows, an analyst, BlackRock’s daily purchase of over $100 million worth of ETH is a strong bullish signal. This institutional interest indicates confidence in Ethereum’s long-term potential.
Furthermore, Ethereum’s inflation rate remains significantly lower than Bitcoin’s, which is a positive factor for its valuation. Additionally, the selling pressure from Grayscale has decreased, further supporting Ethereum’s stability.
Solana’s Sharp Decline vs. Ethereum’s Smooth Slide: AnalysisThe current setup of Ethereum mirrors Bitcoin’s cycle from 2020. Historically, after similar patterns, Bitcoin experienced substantial price increases. Therefore, Ethereum could potentially follow a similar trajectory. If Ethereum’s price begins to rally, the growth could be substantial, echoing past performance in similar market conditions.
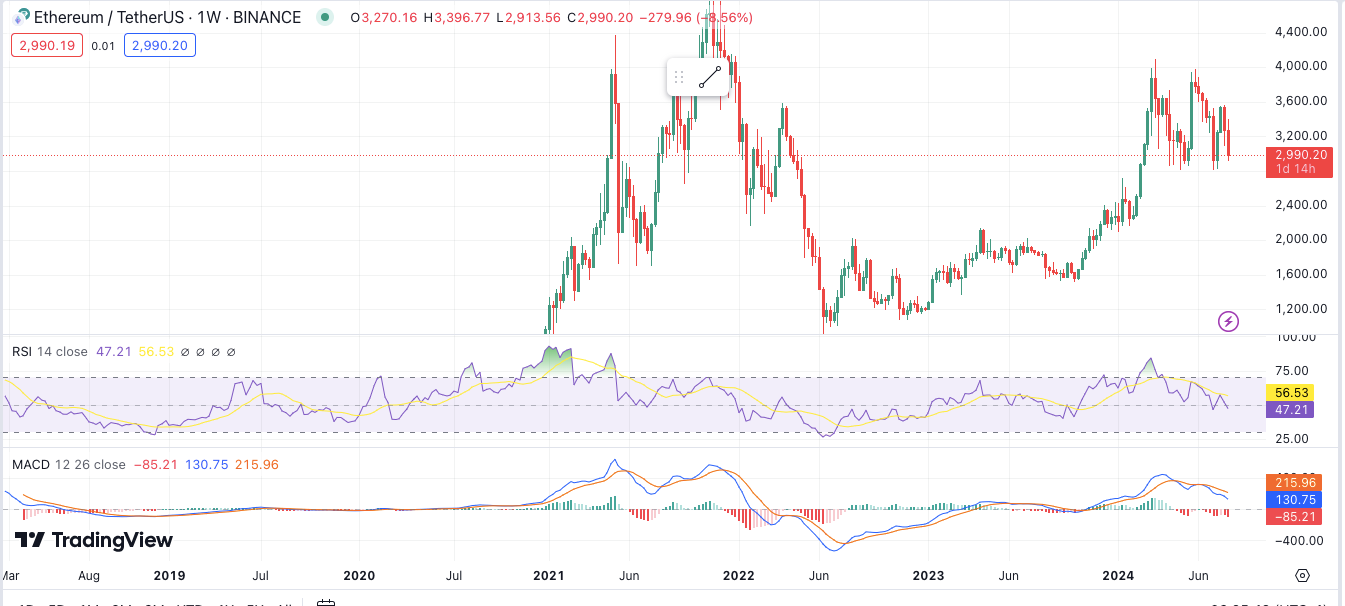
Looking at the technical indicators, the 1-week RSI for Ethereum reads 47.14. This suggests that Ethereum is neither in an oversold nor overbought condition. Consequently, there is room for movement in either direction. However, the 1-week MACD trading below the signal line hints at a possible emerging bearish trend.


