
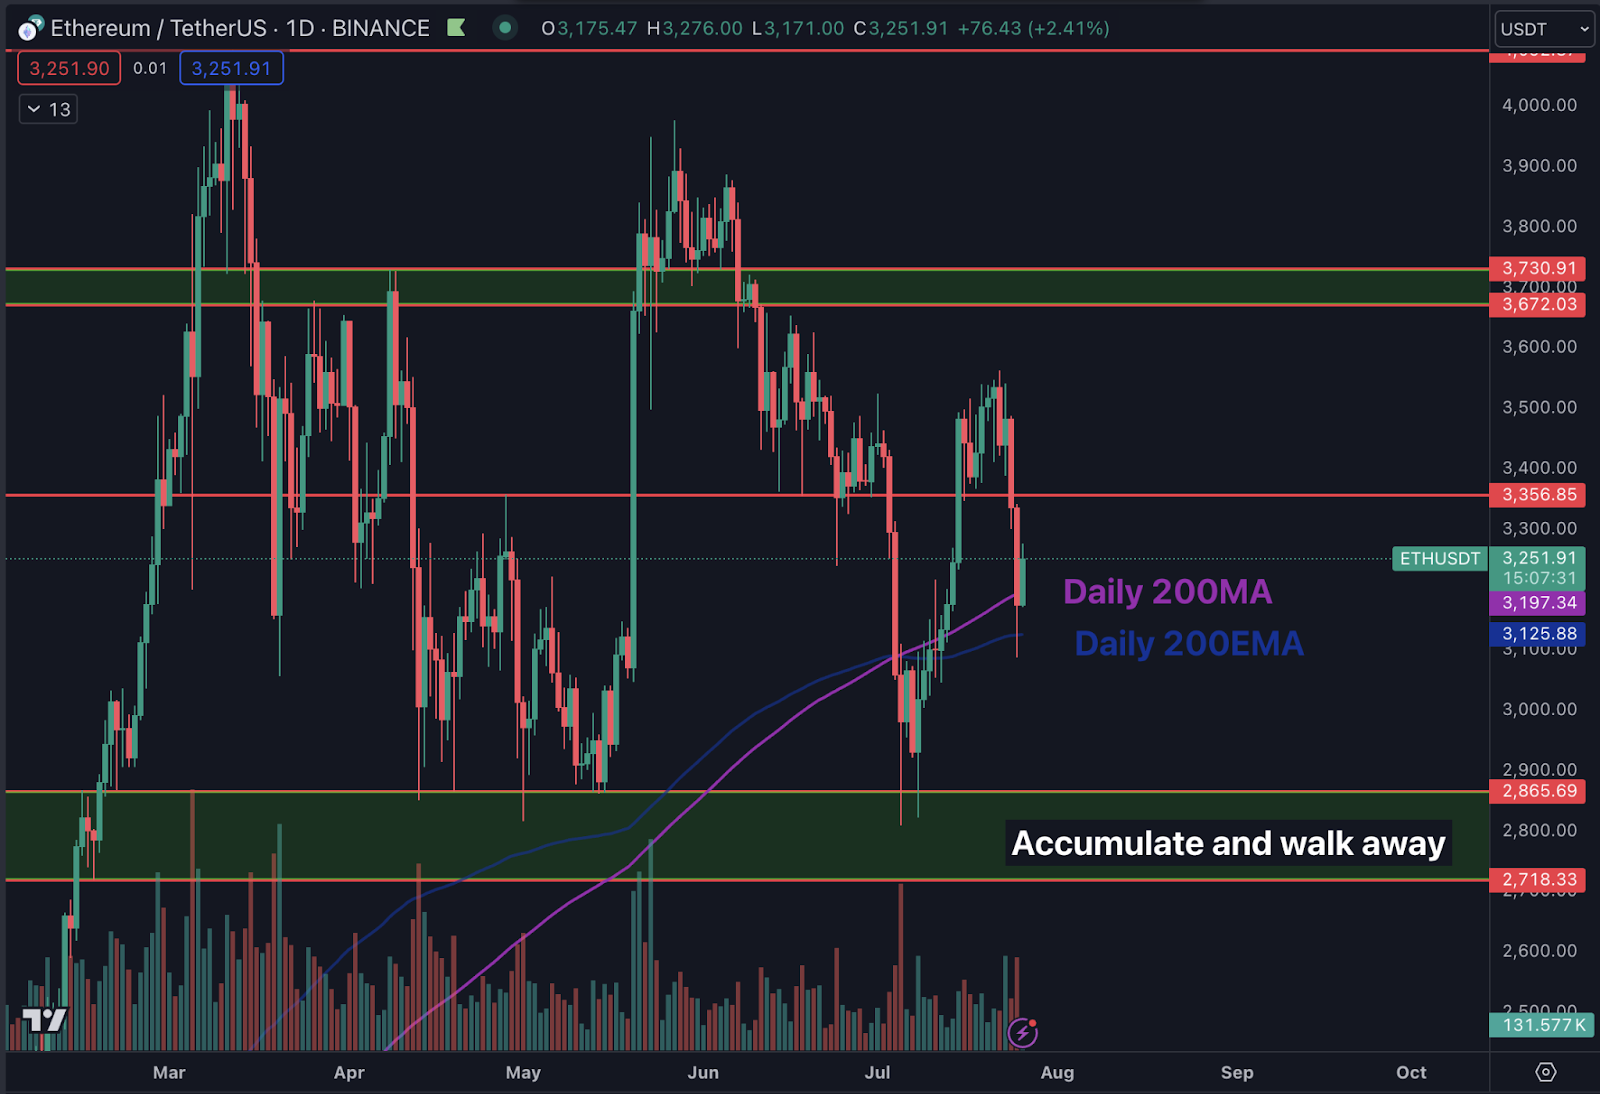
- Ethereum finds strong support at the 200EMA/MA, crucial for sustaining its current uptrend and avoiding lower zones.
- Breaking resistance at $3,356.85 and $3,730.91 could propel Ethereum to new cycle highs amid bullish momentum.
- Weekly RSI at 52.01 shows neutrality, but MACD hints at a potential bearish shift, requiring close monitoring.
Ethereum (ETH) is currently navigating a critical phase in its price trajectory, with recent movements offering crucial insights into its short-term future. At press time, Ethereum is trading around $3,267.42, reflecting a modest increase of 0.89% over the last 24 hours.
The cryptocurrency’s performance has recently shown resilience, bouncing off the daily 200EMA and 200MA as highlighted by Daan Crypto, an analyst. These moving averages, located at approximately $3,197.34 and $3,125.88 respectively, have provided robust support, suggesting their continued importance for the coin’s stability.
The immediate support and resistance levels are pivotal for understanding Ethereum’s current market dynamics. The daily 200EMA and 200MA have proven to be crucial support levels, with the price recently bouncing from these zones.
Should Ethereum break below these moving averages, a revisitation of the lower accumulation zone, which spans from $2,865.69 to $2,718.33, could be seen. This area serves as a significant safety net, indicating potential buy opportunities if the price dips further.
Layer 1 Dominance: Bitcoin, Ethereum, and Solana Drive Crypto Market ResurgenceOn the resistance front, Ethereum faces immediate hurdles around the $3,356.85 mark. This level has previously impeded upward movement, suggesting it will likely act as a key resistance point in the near term. If Ethereum manages to surpass this resistance, the next significant hurdle lies around $3,730.91. This higher resistance level has historically been a strong barrier, making it a critical threshold to watch for potential price movements towards cycle highs.
Mid-term projections are also vital in assessing Ethereum’s trajectory. A mid-term level to monitor is $3,350. This figure represents a crucial pivot point for the coin. Should Ethereum successfully break and hold above this level, it could signal a bullish trend towards higher highs.
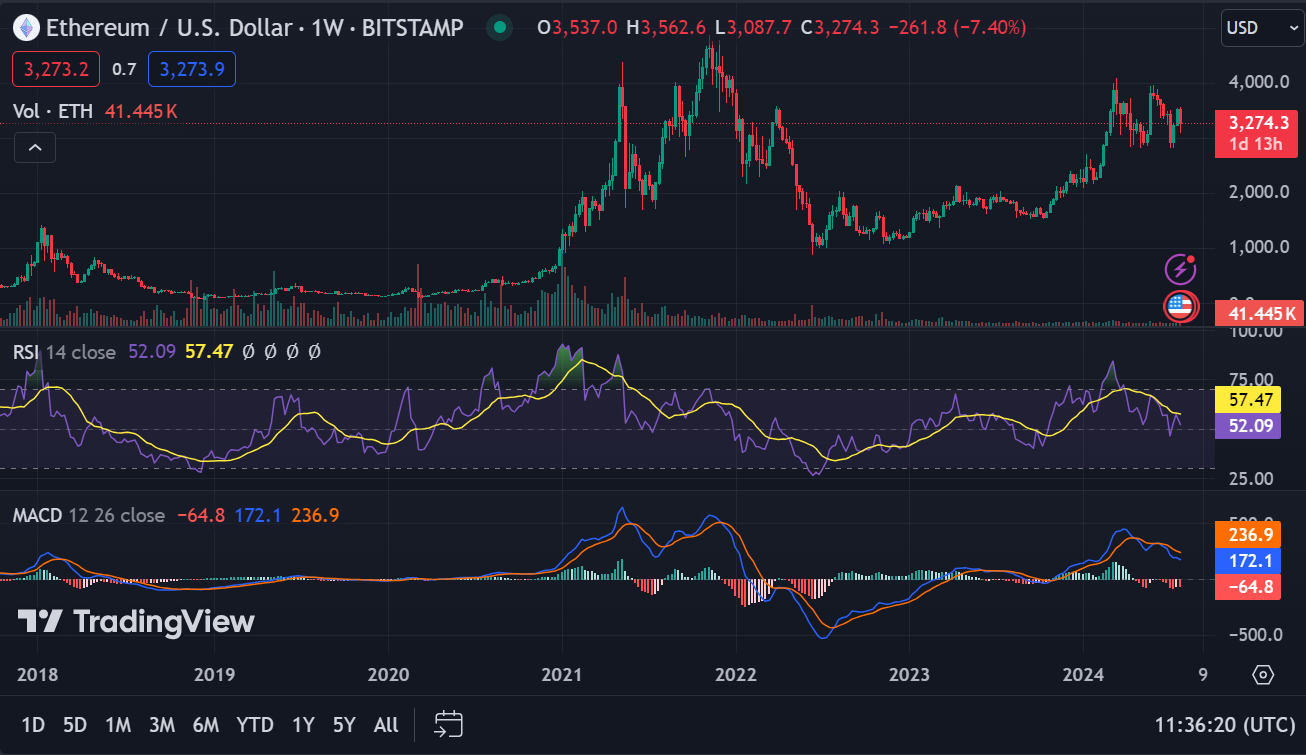
Moreover, analyzing the weekly indicators provides additional context. The 1-week RSI (Relative Strength Index) currently reads 52.01, placing the market in a neutral state. This neutral reading suggests that there is no significant overbought or oversold condition at present. However, the 1-week MACD (Moving Average Convergence Divergence) is trading below the signal line, hinting at a potential bearish shift in the short term.