- Ethereum’s resilience amidst market fluctuations suggests potential for upward momentum, prompting a shift in entry strategies.
- The establishment of a higher low in Ethereum’s price trajectory signals confidence in its bullish narrative.
- Contrasting indicators between Ethereum and Bitcoin underscore the complexity of the cryptocurrency market, requiring nuanced analysis for informed decision-making.
Ethereum (ETH) stands resilient, displaying notable strength that hints at potential upward momentum. As investors analyze the current landscape, it becomes evident that a shift in strategy might be necessary to capitalize on this momentum effectively.
As per CrediBULL Crypto, an analyst, points q dip toward the lower green region for entry. The upper green region emerges as a plausible target for ETH, setting sights on a ride towards the $3500 mark. This strategic shift reflects a nuanced understanding of market dynamics and an adaptive approach to trading in volatile environments.
As further highlighted by DaanCrypto, an analyst, the recent establishment of the first proper higher low in a significant duration injects confidence into the bullish narrative surrounding Ethereum. This development serves as a pivotal indicator, suggesting a potential upward trajectory towards the 0.065 level over the coming weeks. Such projections underscore the optimism surrounding Ethereum’s price action and highlight the strategic opportunities it presents for astute investors.
In the context of broader market dynamics, Ethereum’s performance is juxtaposed against that of Bitcoin (BTC), another leading cryptocurrency. While Ethereum charts its course towards higher highs, Bitcoin remains a focal point of analysis for investors seeking comprehensive insights into market trends.
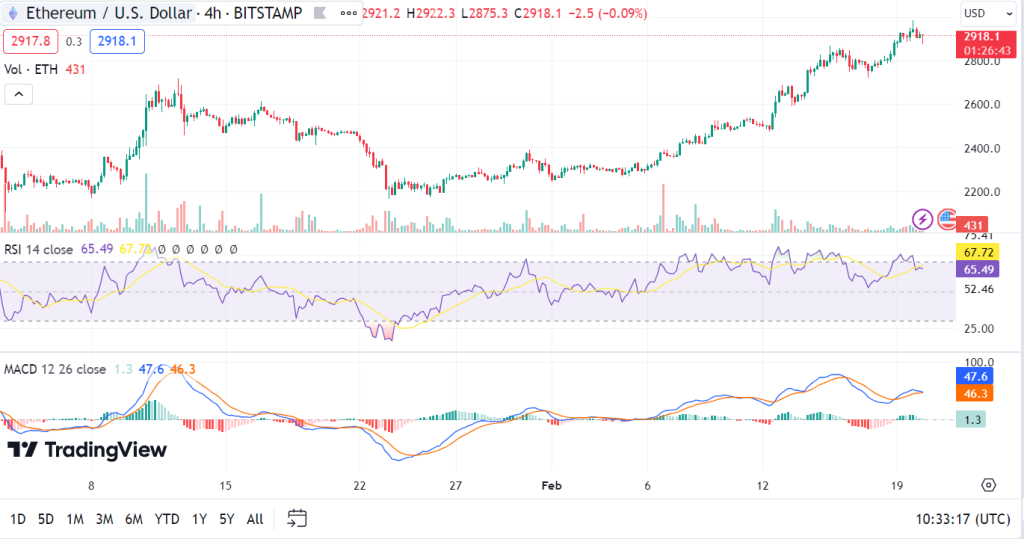
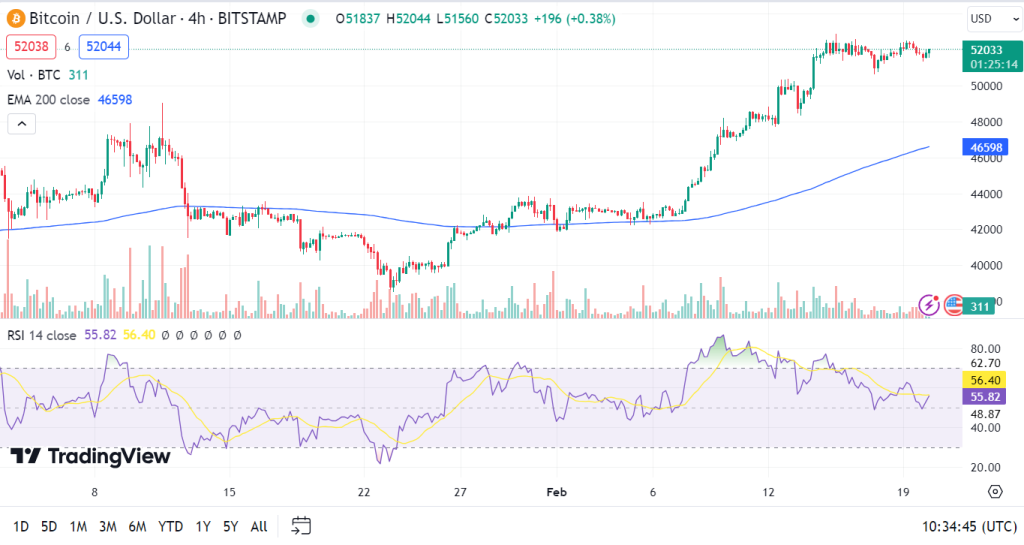
The current Ethereum price stands at $2,895.27, with a 24-hour trading volume of $14.9 billion, reflecting a marginal decline of 0.69% within the same period. Conversely, Bitcoin (BTC) is priced at $51,903.04, accompanied by a 24-hour trading volume of $22.2 billion, registering a similar 0.80% decrease.
Examining Ethereum’s indicators, the 4-hour Relative Strength Index (RSI) stands at 65.49, indicating a favorable position without venturing into overbought territory. Moreover, the 4-hour MACD signals lingering upward momentum, albeit with indications of potential weakening. These nuanced insights offer investors a nuanced understanding of Ethereum’s current positioning and potential trajectory.

Conversely, Bitcoin’s indicators paint a picture of relative neutrality, with the 4-hour RSI hovering at 58.82. While the 4-hour KST suggests a potential bearish trend in the near future, Bitcoin’s price remains above critical moving averages, hinting at a bullish undertone. Such observations highlight the contrasting dynamics at play within the cryptocurrency market, presenting investors with a multifaceted landscape to navigate.

Ethereum’s recent displays of strength instill optimism among investors, prompting strategic recalibrations to capitalize on emerging opportunities. As market dynamics continue to evolve, astute analysis and adaptive strategies remain paramount in navigating the complexities of the cryptocurrency landscape.


