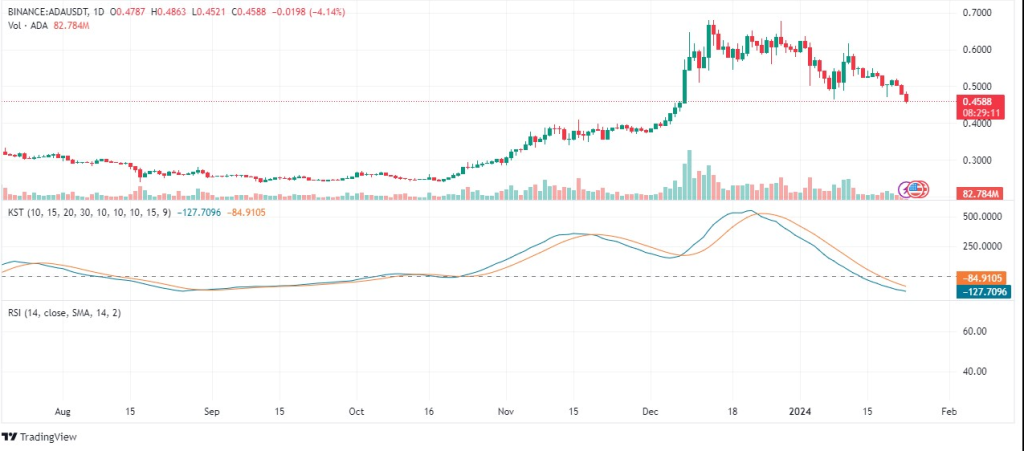
- ADA’s recent price decline and decreasing trading volume signal a short-term bearish trend.
- Technical indicators like the KST and RSI suggest potential further declines before a market reversal.
- Cardano’s slowdown of on-chain activity and reduction of transaction volume raise concerns for ADA’s market outlook.
Cardano’s (ADA) price trajectory has recently taken a noticeable turn, stirring discussions across the cryptocurrency market. With a once soaring market cap nearing $100 billion, as highlighted by Crypto Tony, a renowned crypto analyst, ADA now presents a different story in its market activity. ADA’s price movements often signal broader trends, making its analysis crucial for investors.
ADA’s daily price chart analysis revealed an initial uptrend, followed by a shift toward a downtrend. Significantly, the volume surged alongside the price rise, a common characteristic of strong market trends. However, this volume has been dwindling as prices decline, hinting at reduced trading interest at lower price points.

Moreover, technical indicators paint a more detailed picture. The KST Indicator, a momentum oscillator, shows a downward trend, suggesting bearish momentum. Additionally, the RSI, at the 40 mark, indicates that the market is neither overbought nor oversold. Consequently, there might be room for further decline before any potential market reversal.
Furthermore, an analysis of moving averages reveals a bearish signal, with the value of ADA dipping below them. This alignment, with the shortest on top, traditionally signals a bearish trend. The recent price action, characterized by large red candles, corroborates this, indicating strong selling pressure.
Besides, Cardano’s on-chain activity raises concerns. A significant reduction in large transaction volumes, typically associated with whale movements, has led to a near standstill in network activity. Hence, there’s speculation about the motives behind this decline, be it accumulation, redistribution, or other factors.
However, it’s crucial to consider Cardano’s broader market position. According to data from DeFiLlama, Cardano’s network holds a Total Value Locked (TVL) of about $328.74m ADA. Additionally, recent financial data from CoinMarketCap shows a price of $0.455743 for ADA, marking a decrease of 8.58% in the last 24 hours.
These factors suggest a bearish trend for Cardano in the short term. The increased volume on down days and the RSI readings imply that the market might not have hit its lowest point yet.
ADA’s market scene portrays an interplay of technical indicators and on-chain activities. Investors should exercise caution and closely monitor these developments to navigate the volatile crypto market effectively.


