


- Fetch.ai’s chart suggests a potential rally to $5.1, a 433.7% increase.
- Injective Protocol shows resilience at $20 support, targeting $58.2.
- Floki Inu’s analysis indicates a bearish trend with a 62.06% decline.
Recent analyses by Crypto Knight provide a comprehensive look into the price movements and potential future trends of Fetch.ai (FET/USDT), Injective Protocol (INJ/USDT), and Floki Inu (FLOKI/USDT). Each of these cryptocurrencies has exhibited significant historical support and resistance levels, distinct price patterns, and projected future movements.
The analysis of Fet USD (FET/USDT) charts highlights crucial historical support and resistance levels. The blue shaded region at the bottom indicates a strong historical support zone at $1.3, tested multiple times over the years.
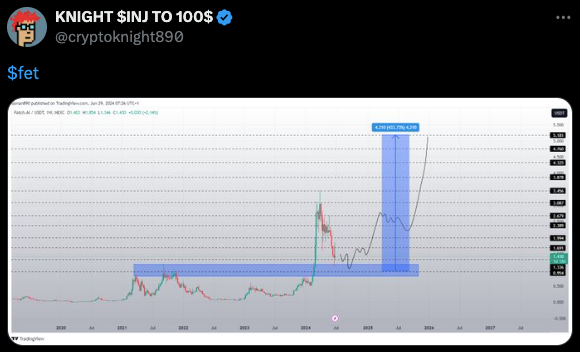
Above this, multiple horizontal resistance lines mark significant price levels that might act as barriers. Mid-2023 saw a significant rally, peaking around $3.4, before a sharp decline followed by stabilization. The chart suggests a potential future rally, with a price projection as high as $5.1, indicating a possible 433.7% increase from the current level.
For Injective Protocol (INJ/USDT), the weekly chart analysis emphasizes a critical support zone below $20. This support has shown resilience, preventing further price declines. Historical price movements indicate significant volatility, with notable peaks and troughs.
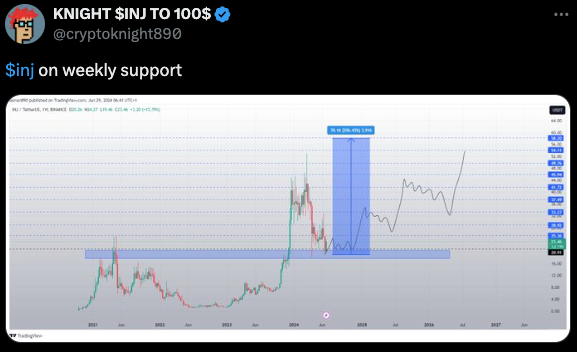
After a substantial peak above $40 around mid-2023, the price corrected sharply and is now consolidating within the support zone, suggesting potential accumulation before an upward move. The chart projects a possible future rally with a price target of $58.2, indicating a 206.4% increase from the current level.
Court Dismisses Claims of Secondary Market Sales of Binance CoinThe Floki Inu (FLOKI/USDT) chart analysis indicates that multiple take profit targets (TP1 to TP8) have been hit. The chart projects a possible downward movement, suggesting a potential price decline to around $0.000017802, a decrease of approximately 62.06% from the current level.
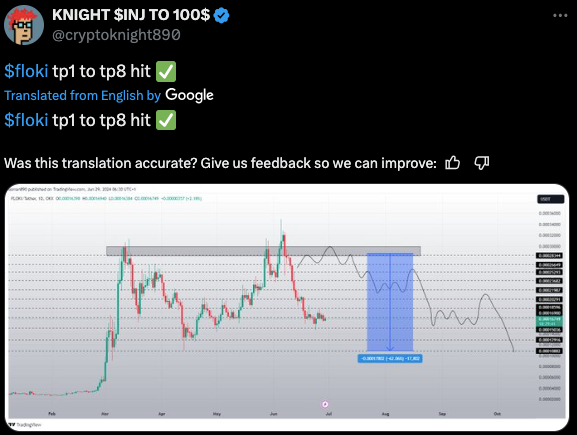
The projected path shows a wave-like pattern, indicating potential phases of consolidation and correction within the overall downward trend. Technical indicators and patterns reveal that the price has been making lower highs and lower lows, indicative of a bearish trend.


