


The 2023 mini rally in cryptocurrencies saw the Fetch.ai network emerge as the top-performing altcoins. Fetch.ai token surged by over +366.51% in the last 60 days. Looking at the fundamental analysis beneath the current price trend,Fetch.ai Network saw its largest ever transaction of $61.2M worth of FET tokens to an existing whale address, which also holds 224.46M in ETH.:
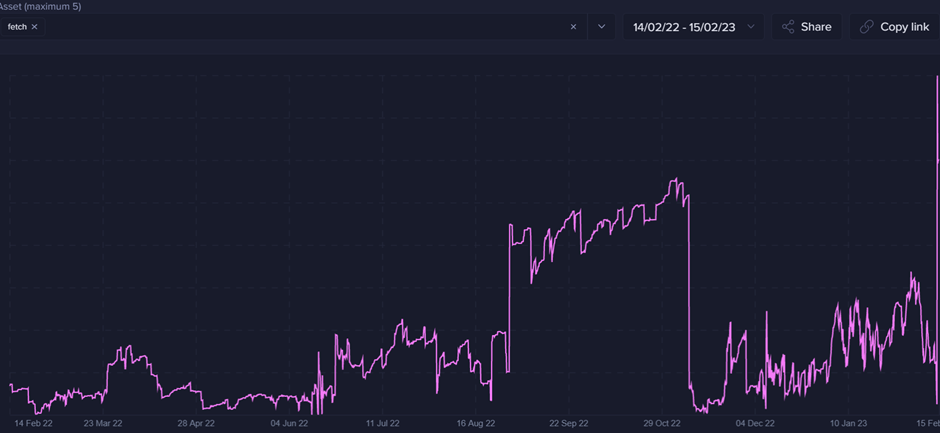
This large transaction has made the network even more attractive as it is now the number 102 asset by market cap in the crypto space and shows that whales are taking a bigger interest in this project. The trading volume of the token is currently at $233,578,414 and has surged by over 185%, according to data from Coinmarketcap.
Fetch.ai price analysis on all timeframes
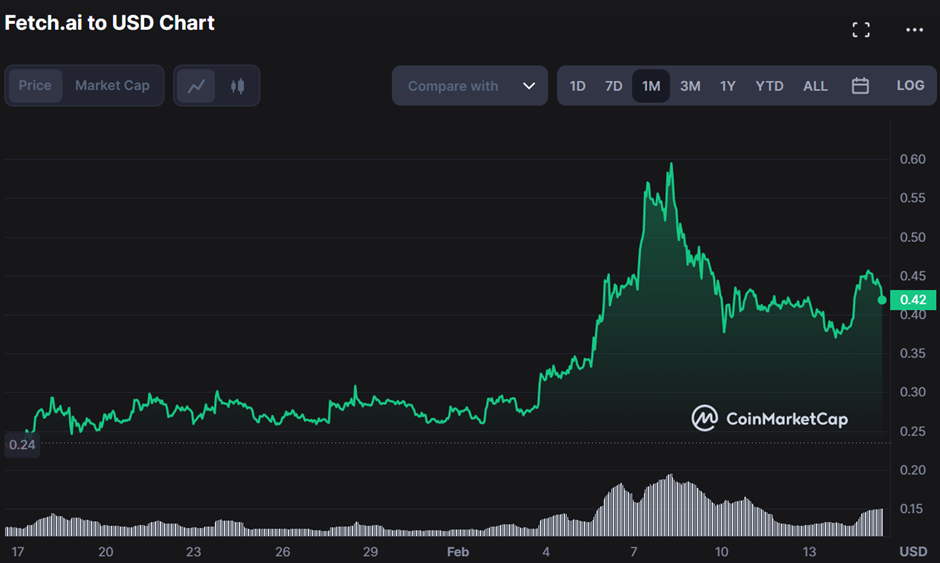
Fetch.ai opened the February month trading session on a bullish note, reaching an intra-month high of $0.5949 on February 8 but has been cut short by this week’s bearish trend. Currently, FET is trading around $0.4313 and has lost -16.06%in the last week after last week’s sell-off.
The Monthly and the weekly RSI are still bullish, residing above the overbought region of 70.00, while the weekly RSI closed on a bearish pattern. The bulls have defended the key support of $0.4200, and the immediate resistance is seen at $0.4500; where if the bulls are able to break above this level, then another upside move toward $0.5000 can be expected in the coming days.
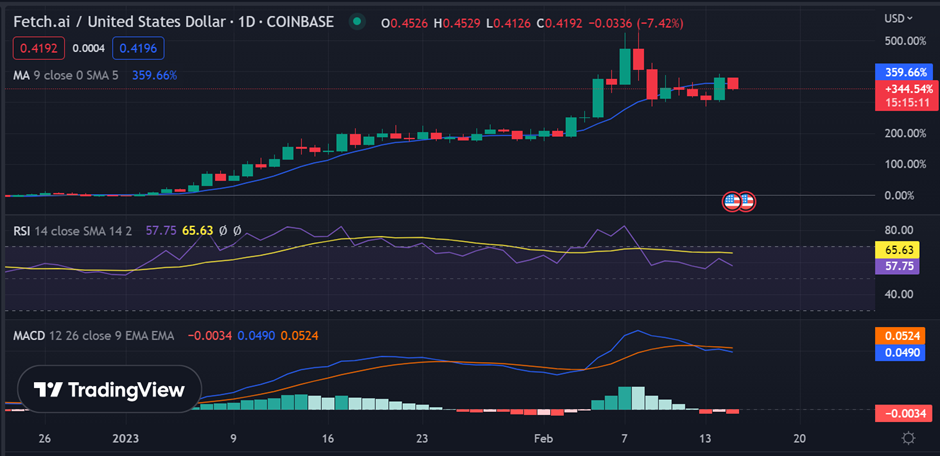
As per the daily chart, FET has broken a major resistance trend line at $0.50 and is currently trading in a sideways range between $0.41 – $0.51.The daily chart shows the buying sentiment has reduced despite a gain of over 9%.
The Relative Strength Index indicator resides around 50.0 levels, indicating the existing bullish momentum is weakening. However, the Moving Average line is residing above the price candles, which indicates a strong uptrend.
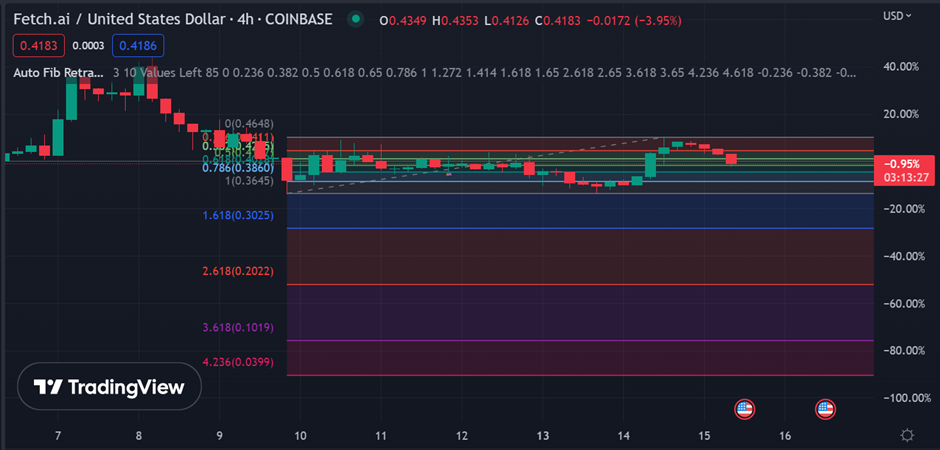
The 4-hour chart shows that the coin is now facing strong resistance at 0.4590, and breaking this level could lead FET to a further surge in the days ahead.
The Fibonacci retracement tool used to measure the price movement between the high and lows of a given time frame suggest that the coin failed to break above the 50.0% level after touching 0.4650, which is now acting as immediate resistance.
Overall, Fetch AI is in an upwards trend with strong bullish momentum but will need to break certain key levels for further upside movements. The coin is currently trading at $0.4313, and the overall outlook of FET remains bullish despite the current bearish pressure.
However, bulls could take a breather, and we could see the prices retrace to the immediate support level at $0.4200. The FET/USD pair has a fair amount of support in this region, and if the buyers manage to defend this level, then we can expect further upside towards 0.4650 in the days ahead.


