


- Filecoin breakout from descending wedge signals potential 103.16% rise to $8.0 target.
- APE tests a key trendline whereby a breakout could lead to $0.94, a 51% potential increase.
- FIL faces resistance at $4.20 with APE support levels at $0.53 and $0.60 are crucial.
Filecoin (FIL) and ApeCoin (APE) are two cryptocurrencies currently drawing attention due to their notable price movements and potential bullish breakouts. Technical analysis of the FIL/USDT and APE/USDT pairs, both traded on Binance, highlighted significant patterns and key price levels that are worth considering for traders.
ZAYK Charts analysis suggests that the daily price chart of Filecoin against Tether (USDT) revealed a descending wedge pattern. This pattern, often associated with bullish reversals, has seen the price of FIL moving within two converging trendlines.
Over recent weeks, the price has made a series of lower highs and lower lows, but the range between these highs and lows has been narrowing. This tightening range is typically a precursor to a breakout.
The lower trendline has been a strong support level, situated in the $2.5 to $3.0 range, and has been tested multiple times. Conversely, the upper trendline has served as a resistance level, consistently capping the price advances until recently. A significant development occurred when the FIL broke above this upper trendline. This breakout is a crucial bullish signal, as such moves often lead to strong upward momentum.
Filecoin Sees Potential Upswing Amidst Technical IndicatorsWith this breakout, the next focus is on the potential target. The projected target, based on the wedge pattern, is around the $8.0 level. This suggests a potential 103.16% increase from the breakout point.

However, the price currently faced immediate resistance at around $4.2. A break and hold above this resistance would further confirm the bullish trend and strengthen the case for a move toward the $8.0 target. As at press time, Filecoin is trading at $4.00, with a 24-hour trading volume of $98,838,186, reflecting a 4.90% increase over the last 24 hours.
ApeCoin‘s price chart, analyzed over an 8-hour timeframe, also shows critical developments. Further analysis of the chart revealed a clear downward trend, marked by a descending trendline that had been in place since early June. This trendline has been a key factor in maintaining a bearish sentiment in the market. However, recent price action suggests that APE might be nearing a breakout.
The price has recently approached and tested the descending trendline, which acts as a dynamic resistance level. A close above this trendline could signal a bullish reversal, potentially driving a move to $0.94. This target suggests a potential gain of 51.03% from current levels.
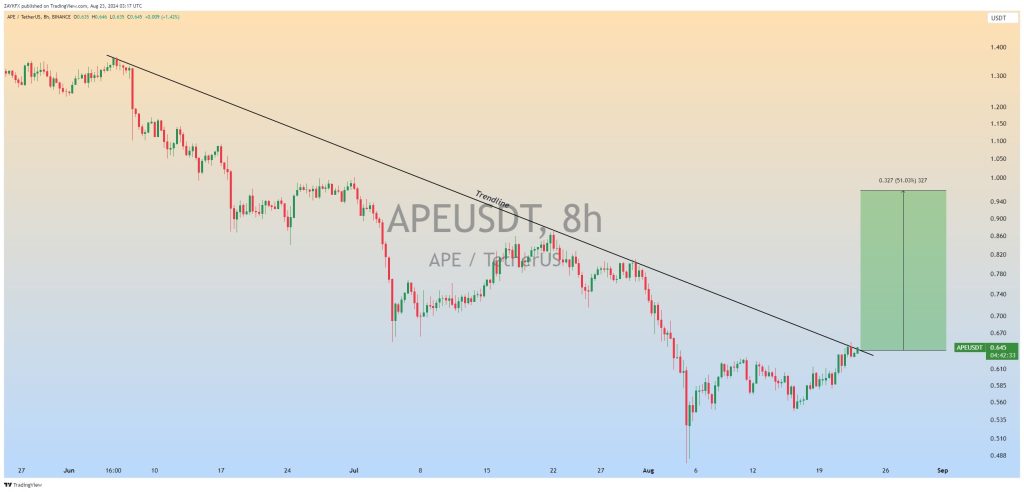
The nearest support levels are around $0.53 and $0.60, both of which have previously attracted buying interest. However, the trendline remained in the primary resistance. A successful breakout above this level could set the stage for a move toward the next major resistance at $0.94.
At publication, ApeCoin is trading at $0.647031, with a 24-hour trading volume of $25,265,872, reflecting a 0.69% increase in the past 24 hours.


