


- FLOKI’s Elliott Wave pattern signals a bullish move, targeting $0.0002200 to $0.0002600 if support holds at $0.0001600.
- Current price consolidation at $0.00017448 suggests potential for a breakout if FLOKI maintains support above $0.0001600.
- With RSI at 53.25 and MACD above the signal line, FLOKI shows balanced sentiment and short-term upward momentum.
FLOKI (Floki Inu) is garnering significant attention, particularly as it shows potential for a breakout within the next 24 hours as highlighted by AltstreetBet, an analyst. Analyzing the 4-hour price trend for FLOKI against Tether (USDT) on Binance reveals key technical indicators and patterns that suggest a bullish trajectory.
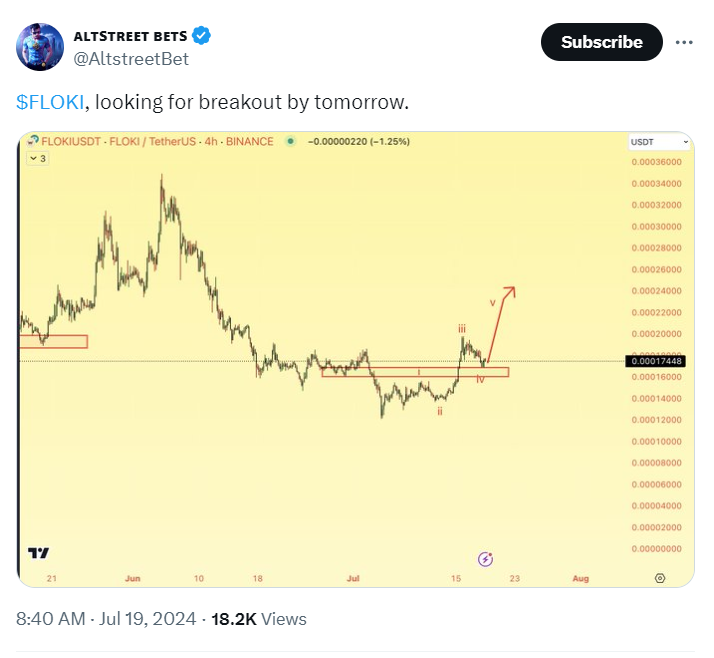
Currently, FLOKI’s price action is following an Elliott Wave pattern, which is crucial for forecasting potential future movements. According to the chart, FLOKI is in Wave IV of the Elliott Wave cycle, with an anticipated move towards Wave V. This pattern indicates a likely continuation of the bullish trend if certain conditions are met.
The lower red horizontal line at $0.0001600 marks a significant support zone. This level coincides with the base of Wave I and Wave IV, making it a crucial point for maintaining the bullish outlook.
Additionally, the current price level around $0.00017448 serves as another support point, where the price is currently consolidating after a minor pullback. If FLOKI manages to stay above these support levels, it could pave the way for an upward move.
Resistance levels also provide insight into potential price targets. Historical data suggests that $0.0002200 is a notable resistance point. Moreover, another resistance level at $0.0002600 has previously shown significant resistance, making these points crucial for evaluating potential profit-taking opportunities. If the price breaks through these resistance levels, it could signal a continuation of the bullish trend.

The expected movement for FLOKI is a rise towards Wave V, indicating that the price might increase towards the range of $0.0002200 to $0.0002600 . This projection is supported by current technical indicators.
Polkadot (DOT) Eyes $9.20, Floki (FLOKI) Targets 64.93% Surge: What’s Next?The live price of FLOKI at press time stands at $0.000178, with a 24-hour trading volume of $259,905,822. Despite a recent decline of 2.00% in the past 24 hours, technical indicators provide a balanced market sentiment.
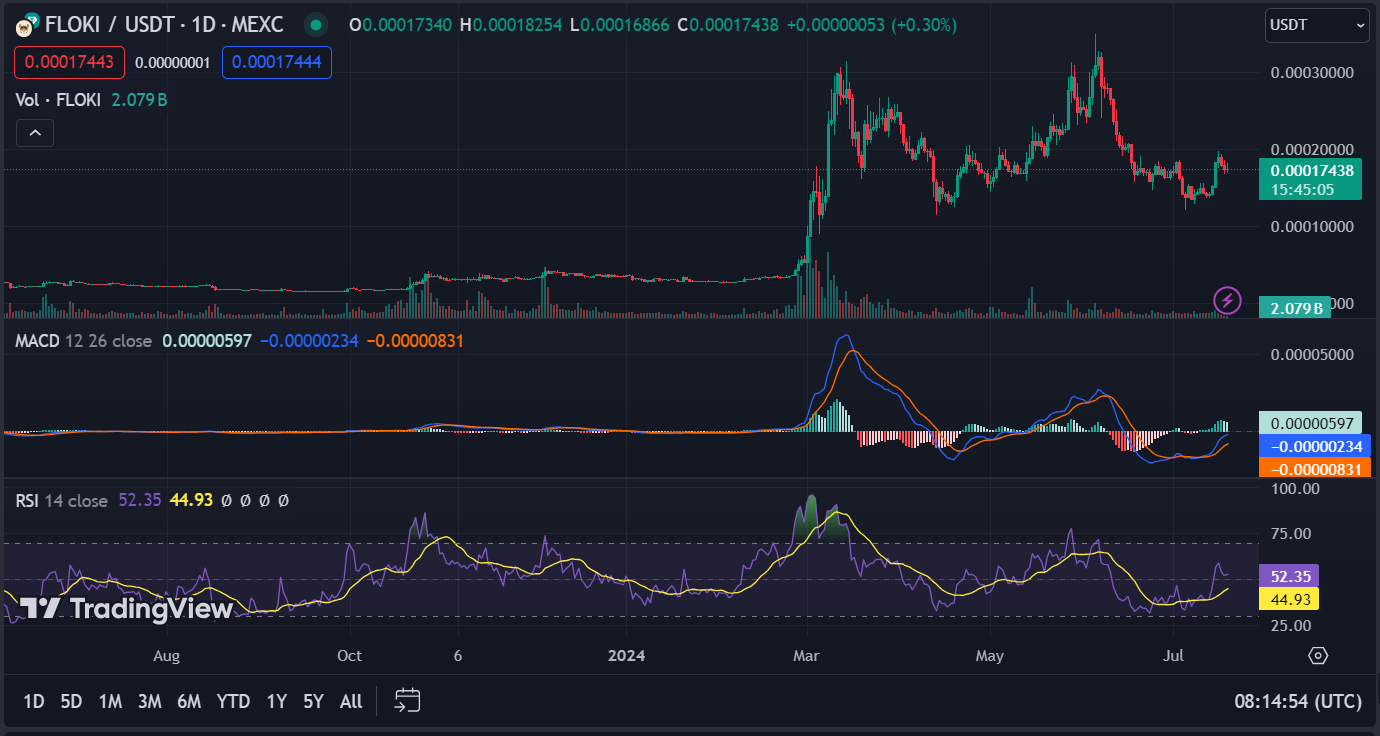
The 1-day RSI for FLOKI is currently at 53.25, suggesting that the cryptocurrency is neither overbought nor oversold. This balanced RSI reading indicates a stable market sentiment. Additionally, the 1-day MACD trading above the signal line hints at potential short-term upward momentum.


