


The native token of the Gamiumcorp GMM project saw an incredible surge of 626% today after the news of its partnership with Meta and Binance. The new collaboration seeks to bring more benefits to the project’s users and will allow them to access a wider range of services.
The strong market performance seen since the announcement could also suggest that investors are feeling confident about the project’s growth potential in the coming months.
The partnership is expected to bring a greater degree of transparency and security to the platform while also providing access to a larger customer base and network.
Gamium GMM price analysis
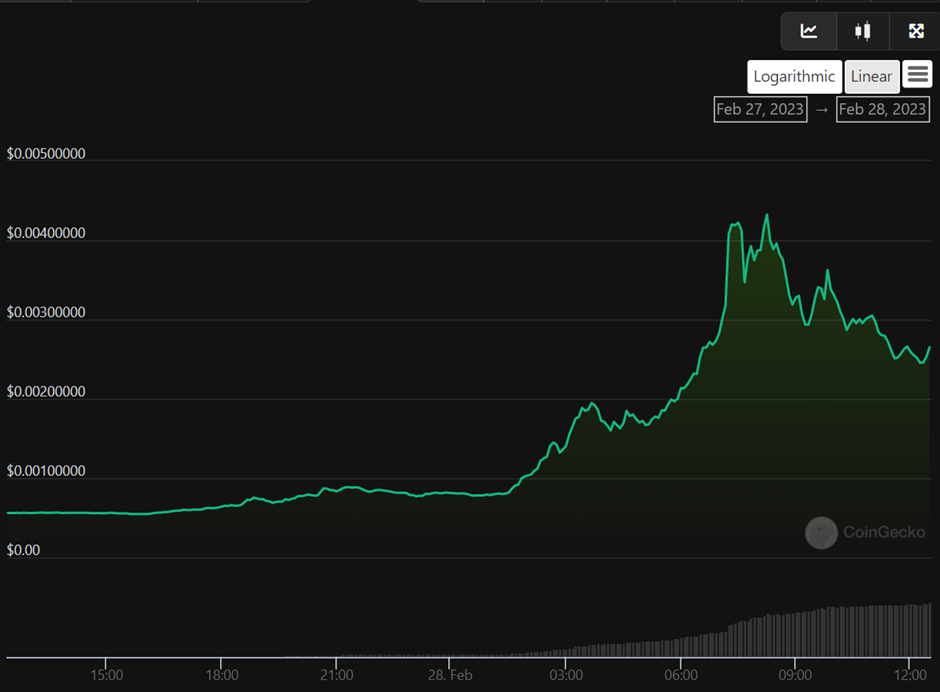
Gamium token’s price at the moment of writing is $0.00268479, having grown from $0.00054682, a surge of 372%. The token has been on an upward trend since the announcement and seems to cool off as traders take profits.
The token has been forming neck and shoulder formations, similar to those seen in stocks, indicating that the rally might be over and a possible reversal could be imminent. The first level of support is at $0.002110, and if it breaks this, prices may potentially drop to $0.0015 or even lower levels in the near future.
The next neckline that seems to be broken is situated at $0.0032; if GMM is able to break this level, then it may potentially reach the next resistance at the $0.0040-42 range and possibly go even higher in the near future.
Looking at the daily chart, GMMT/USD pair has formed a triangle pattern, with the price forming higher highs at $0.004189912, lower high at $0.004050371, and higher lows at $0.002677673.
It appears that the price is attempting to break out of this pattern, with buyers poised to take control of the market if they manage to take it past its current resistance of $0.0032.
On the daily chart, GMMT/USD pair has formed long bullish candlesticks, which could indicate that a new uptrend is forming. At the same time, there could emerge a bearish divergence near the resistance level, and a breakdown could take the price back to $0.002110 or lower.
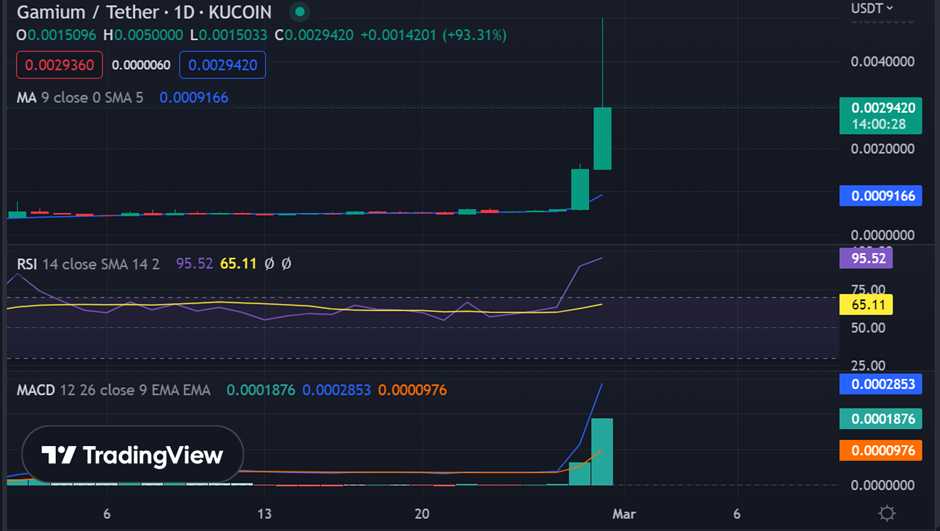
The Relative Strength Index is highly oversold, as it is residing at 95.0, which could be an indication that a pullback is impending. The MACD indicator is pointing upwards and well positioned above the zero line, which could indicate that buyers are in full control of the market.
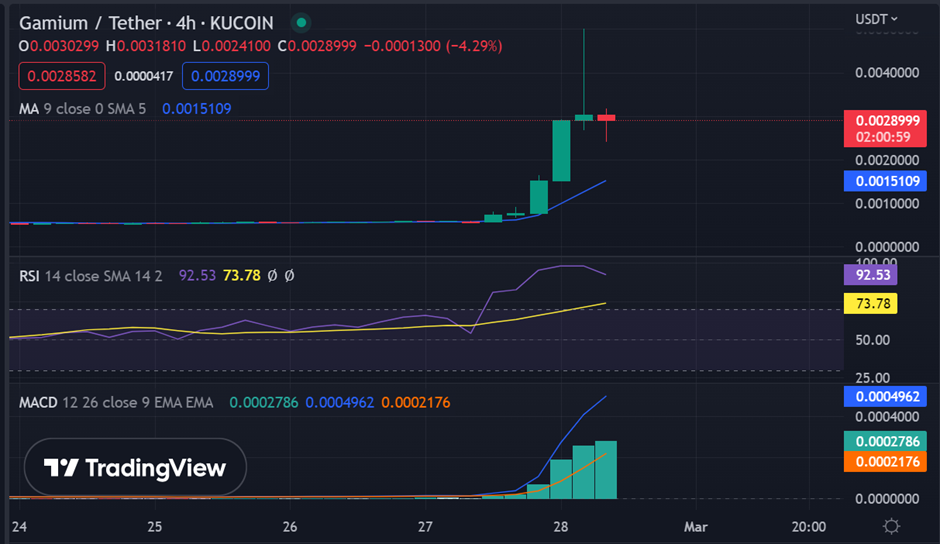
On the 4-hour chart, a bullish engulfing pattern has been formed, which could signal the start of a new uptrend. The price is now trading above all three major moving averages, with the 50-EMA providing strong support at $0.002250.The RSI indicator is in bullish territory and currently stands at 97.82, which could be an indication of a potential trend reversal.
Overall, the GMM token is in a strong uptrend and could potentially reach higher levels in the near future if bulls can push the price past its resistance level. The token is currently taking a breather, with traders taking profits; however, if it breaks its resistance level, it could potentially increase in price further. The next key levels to watch out for are $0.0032 and then $0.0040-42.


