


- Hedera leads in development frequency for the second month, highlighting its growing prominence in the crypto space.
- Despite a 2.82% drop in HBAR’s price, increased trading volume (+15.67%) suggests heightened activity and potential volatility.
- Technical indicators hint at a possible HBAR price reversal, with RSI nearing oversold conditions and MACD showing bullish momentum.
Hedera’s growing prominence as a top crypto development project continues to make waves. As highlighted by Hedera on their official X page, for the second consecutive month, Hedera has been ranked as the leading crypto project in terms of development frequency by Web3 analytics firm Santiment. This accolade underscores the increased ease of building on the Hedera network. Despite this progress, HBAR, the native token of the Hedera network, faces significant selling pressure and declining prices.

The token’s current price is $0.07502, reflecting a 2.82% decrease over the last 24 hours. The market is closely watching this bearish trend, with the next critical support level pegged at $0.07 if the downtrend persists.
Despite these challenges, there is optimism about a potential reversal. Market analyst, Crypto Girl, anticipates that HBAR could play a crucial role in the forthcoming bull run, given its recent 120% profit boost.
Examining the key metrics, Hedera’s market cap stands at $2,682,632,226, with a 24-hour trading volume of $51,878,489, marking a 15.67% increase. The volume-to-market cap ratio is 1.94%, indicating active trading and potential volatility. The circulating supply of HBAR is 35,761,094,688, which constitutes 71.52% of its total supply of 50,000,000,000 tokens.
Hedera Tops in Development Activities Surpassing Optimism and CardanoPrice chart analysis reveals that the daily high and low for HBAR are approximately $0.079 and $0.074, respectively. The immediate support level is around $0.074, while the immediate resistance is around $0.079. If the price drops below $0.074, the next support level is anticipated at $0.073 based on historical price movements. Conversely, if the price exceeds $0.079, the next resistance level could be around $0.080.
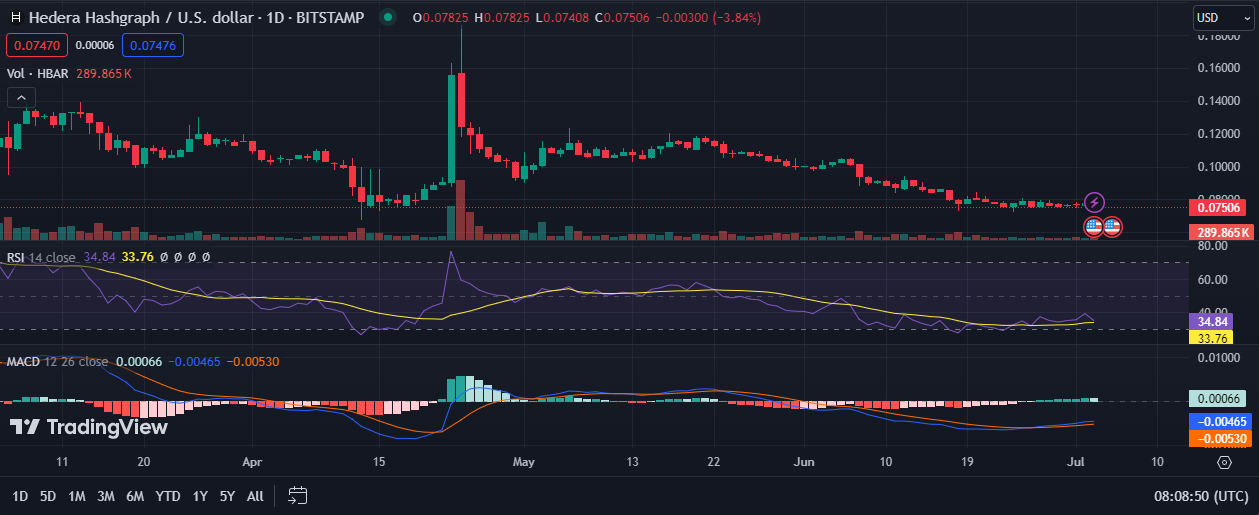
Market sentiment indicates a decline, as evidenced by the 2.82% drop in the last 24 hours. However, the increased trading volume suggests heightened activity and potential price swings. Hedera’s 1-day Relative Strength Index (RSI) is 34.84, suggesting that the asset might be nearing oversold conditions in the short term. Additionally, the 1-day Moving Average Convergence Divergence (MACD) trading above the signal line points to emerging bullish momentum.


