
- HBAR’s symmetrical triangle pattern indicates a potential bullish breakout, but caution is advised amid short-term bearish signals.
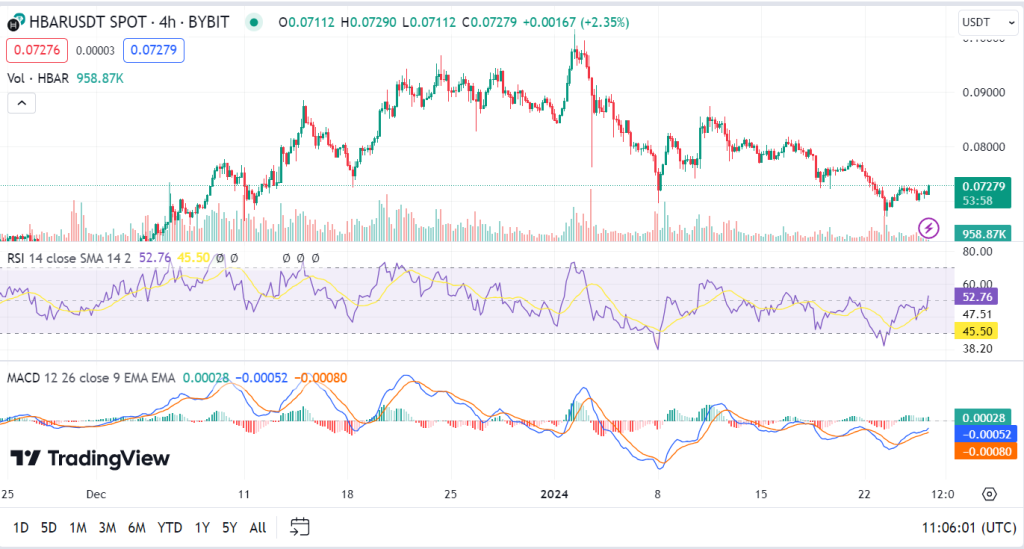
- The 4-hour RSI of 48.34 suggests a balanced market sentiment, offering opportunities for both buyers and sellers.
- Traders should be prepared for consolidation in HBAR’s price due to minimal MACD divergence, emphasizing the need for strategic planning.
Hedera Hashgraph (HBAR) has been catching the attention of crypto enthusiasts and investors alike in 2024, forming a promising bullish setup within a symmetrical triangle pattern as per jaydee, an analyst. This intriguing development comes amid increased scrutiny of noise, news, and partnerships in the crypto space as traders seek to focus on the essential truth of market dynamics.
As of the latest data, the live Hedera price is $0.071614, with a 24-hour trading volume of $28 million. Over the last 24 hours, HBAR has shown a modest increase of 0.12%, highlighting its relative stability in the short term.
The 4-hour Relative Strength Index (RSI) for Hedera currently registers at 48.34, signifying a relatively neutral momentum in the cryptocurrency market. This suggests that HBAR is neither significantly overbought nor oversold, providing traders with a balanced market sentiment to analyze and make informed decisions. This equilibrium is a potential opportunity for both buyers and sellers.
A closer look at the 4-hour Know Sure Thing (KST) indicator reveals a slight bearish momentum in the short term. The negative value of the KST suggests that Hedera’s price may encounter a period of downward movement or consolidation in the near future. While this might concern some traders, it also presents an opportunity for those looking to enter the market or accumulate more HBAR at a potentially lower price point.
Examining the 4-hour Moving Average Convergence Divergence (MACD) indicator, there is minimal divergence between the cryptocurrency’s short-term moving averages. This lack of pronounced buying or selling pressure in the market implies the likelihood of a period of consolidation or sideways movement in HBAR’s price. Traders should be prepared for this scenario and develop strategies accordingly.
Hedera Hashgraph’s current price action and technical indicators suggest a balanced market sentiment with potential short-term bearishness. While the symmetrical triangle pattern hints at a significant breakout on the horizon, traders must exercise caution and consider the broader market context.
Investors can make informed decisions and navigate the crypto space’s noise and news by focusing on the truth of the charts and technical indicators. As always, they should remember that cryptocurrency investments carry inherent risks, and it’s crucial to conduct thorough research and risk management before making any decisions in this volatile market.