


- ZAYKCharts points out a bullish breakout through a previously descending trendline, indicating a potential shift of the bearish trend.
- Recent bullish crossovers in the Moving Average Convergence Divergence signal short-term recovery potential.
- Know Sure Thing indicator confirms increasing bullish momentum, reinforcing the potential for continued price recovery.
ZAYKCharts, a noted cryptocurrency analyst, recently highlighted a significant development in Bitcoin’s trading pattern on X. The analyst pointed out a bullish breakout through a previously descending trendline, indicating a potential shift of the bearish trend coming out since early February. Additionally, the most recent trading data indicates that Bitcoin (BTC) is currently priced at around $60,950, which marks a decrease of 3.55% within the past day.
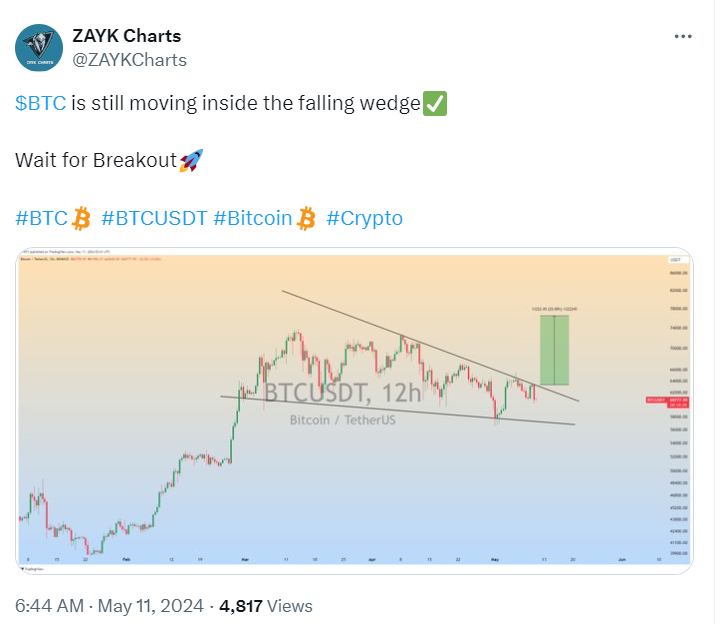
Moreover, the 12-hour price chart analysis by ZAYKCharts illustrates a key dynamic resistance line and horizontal support at approximately $52,000. Consequently, the breakout through this resistance could mark the beginning of a bullish phase. Moreover, there’s a projected target between $70,000 and $74,000, suggesting a potential 20.89% increase from the breakout point.
Is a Bearish Trend Ahead for Bitcoin?
On the technical front, Bitcoin’s 4-hour price chart presents several indicators suggesting a shift in market dynamics. The 200-period Exponential Moving Average (EMA) indicates a long-term bearish trend. However, recent bullish crossovers in the Moving Average Convergence Divergence and the Relative Strength Index signal (RSI) short-term recovery potential. Additionally, the RSI’s current level of 56.28 points towards increasing bullish momentum without nearing the overbought territory.
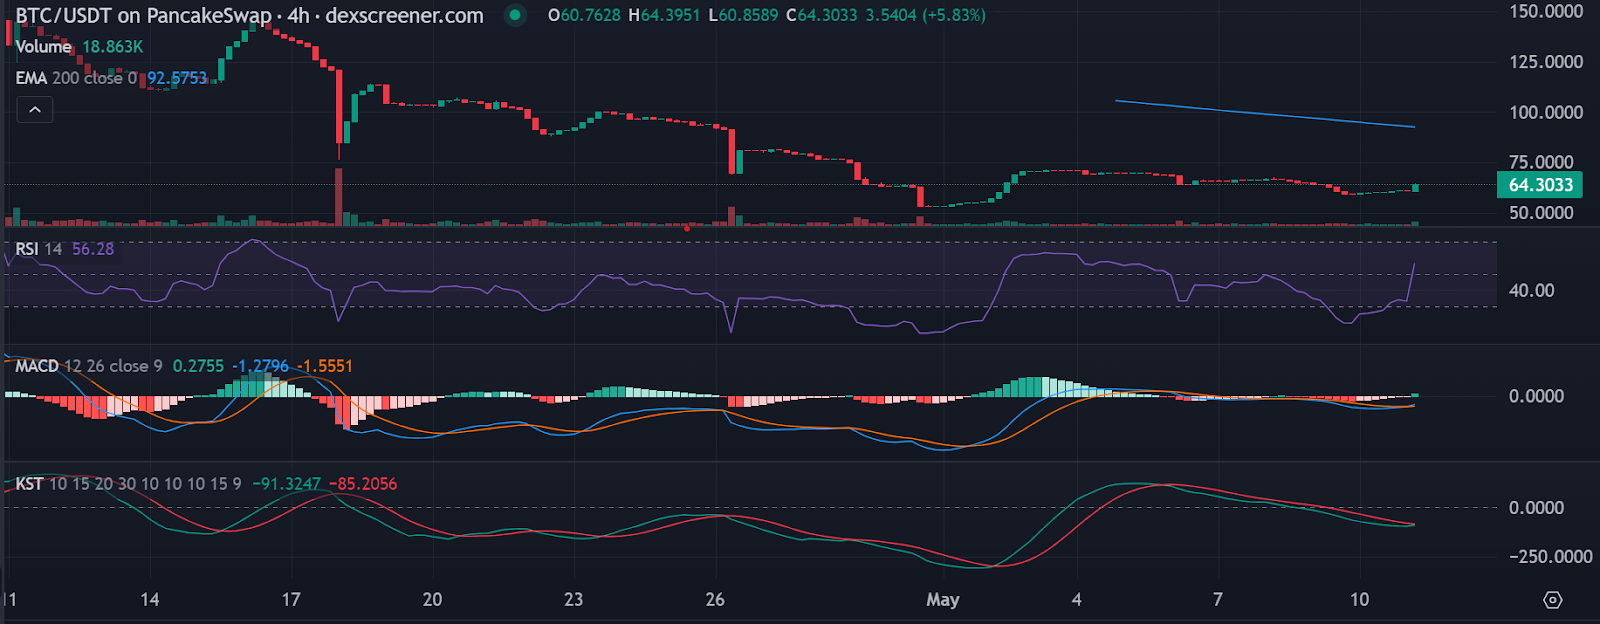
Significantly, the volume indicator reflects high trade volumes correlating with notable price movements, indicating strong market engagement. Moreover, the Know Sure Thing (KST) indicator confirms increasing bullish momentum, reinforcing the potential for continued price recovery. However, traders should remain vigilant as the price still resides below the 200 EMA, suggesting the need for cautious optimism in the face of ongoing volatility.
Traders might view the current setup as an opportunity to establish long positions, anticipating further increases. Besides, the green target area provides a focal point for potential profit-taking should the price ascent continue as projected.


