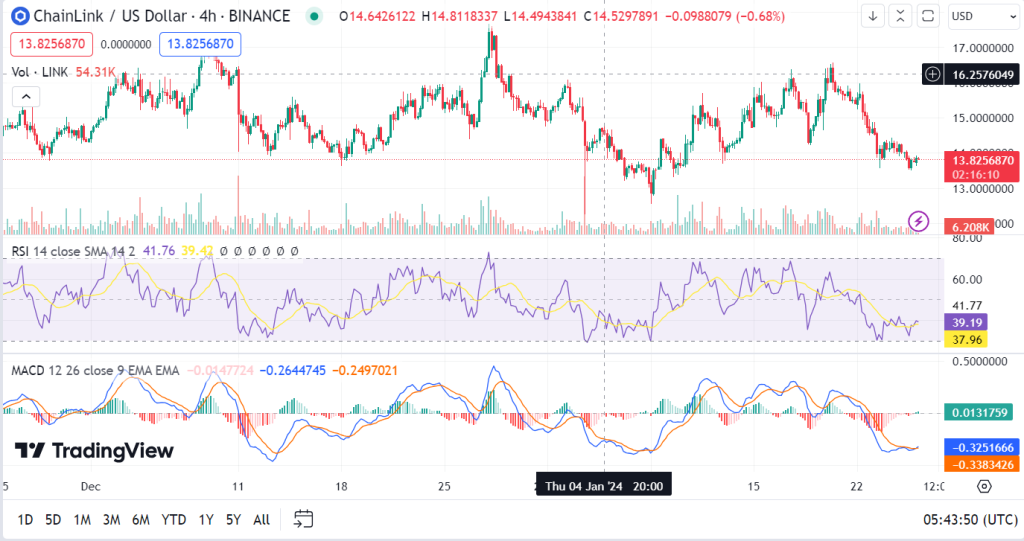
- Chainlink’s RSI at 38.89 suggests potential undervaluation, hinting at a possible price reversal.
- Mixed signals from RSI, KST, and MACD indicate uncertainty in Chainlink’s short-term trajectory.
- A breakout above 4500 sats could mark a bullish trend for Chainlink, targeting 9000 sats.
The cryptocurrency market is witnessing a fascinating development with Chainlink (LINK) against Bitcoin (BTC), as investors and analysts closely monitor its price movements. Despite a recent dip in its price, Chainlink shows promising signs of a major breakout. Currently priced at $13.81, with a 24-hour trading volume of $329,687,197, Chainlink has experienced a slight decline of 0.62% in the last day. However, the underlying market indicators suggest a more complex scenario.
Chainlink’s Relative Strength Index (RSI) on the 4-hour chart stands at 38.89. This figure indicates that the asset might be nearing oversold territory. An RSI below 40 often suggests that a security is becoming undervalued and may be due for a reversal. This potential reversal is crucial for investors considering buying the dips.
Moreover, the current 4-hour Know Sure Thing (KST) points to Chainlink’s short-term momentum being strongly bearish. This implies that the asset is currently facing significant selling pressure. Consequently, this selling pressure might limit any immediate upward price movements, aligning with the cautious sentiment among investors.
Additionally, the 4-hour Moving Average Convergence Divergence (MACD) for Chainlink indicates a slightly bullish trend in the short term. This divergence between the MACD and the other indicators highlights the uncertainty in Chainlink’s immediate price movements. While the MACD suggests a potential for upward movement, the low RSI and negative KST could dampen this momentum.

Investors are particularly keen on Chainlink’s performance against Bitcoin. As per Michaël van de Poppe, a renowned blockchain figure, a breakout above 4500 sats could signal a significant bullish trend, potentially leading the price to soar to 9000 sats. This level is crucial for Chainlink, as breaking out of this ‘red zone’ would confirm the bullish trend.
Hence, while the current market indicators present a mixed picture, the possibility of a major breakout remains a point of focus. Investors are advised to watch these indicators closely, as they could provide crucial insights into Chainlink’s short-term price movements. The cryptocurrency market is known for its volatility, and Chainlink’s current position makes it a fascinating asset to watch in the coming months.


