


- PEPE’s recent price decline mimics FLOKI’s previous distribution phase, indicating further drops.
- CrediBULL Crypto’s analysis suggests PEPE may follow FLOKI’s path, seeking new support levels soon.
- PEPE’s RSI indicates it is approaching oversold territory, which aligns with the crypto analyst’s prediction.
CrediBULL Crypto, a crypto analyst on Twitter, recently highlighted notable trends in the price movements of PEPE and FLOKI. He drew parallels to similar patterns seen in Bitcoin (BTC), highlighting the possibility of a price breakdown. This analysis explores the potential implications for these meme-based cryptocurrencies, focusing on their historical performance and market behavior.
PEPE, launched on the Ethereum blockchain, gained popularity due to its connection to the Pepe the Frog internet meme. During its peak, PEPE’s market cap soared to approximately $1.6 billion, highlighting its substantial impact. The coin reached its all-time high of $0.00001718 in May 2024 but has since declined by about 33.59%.
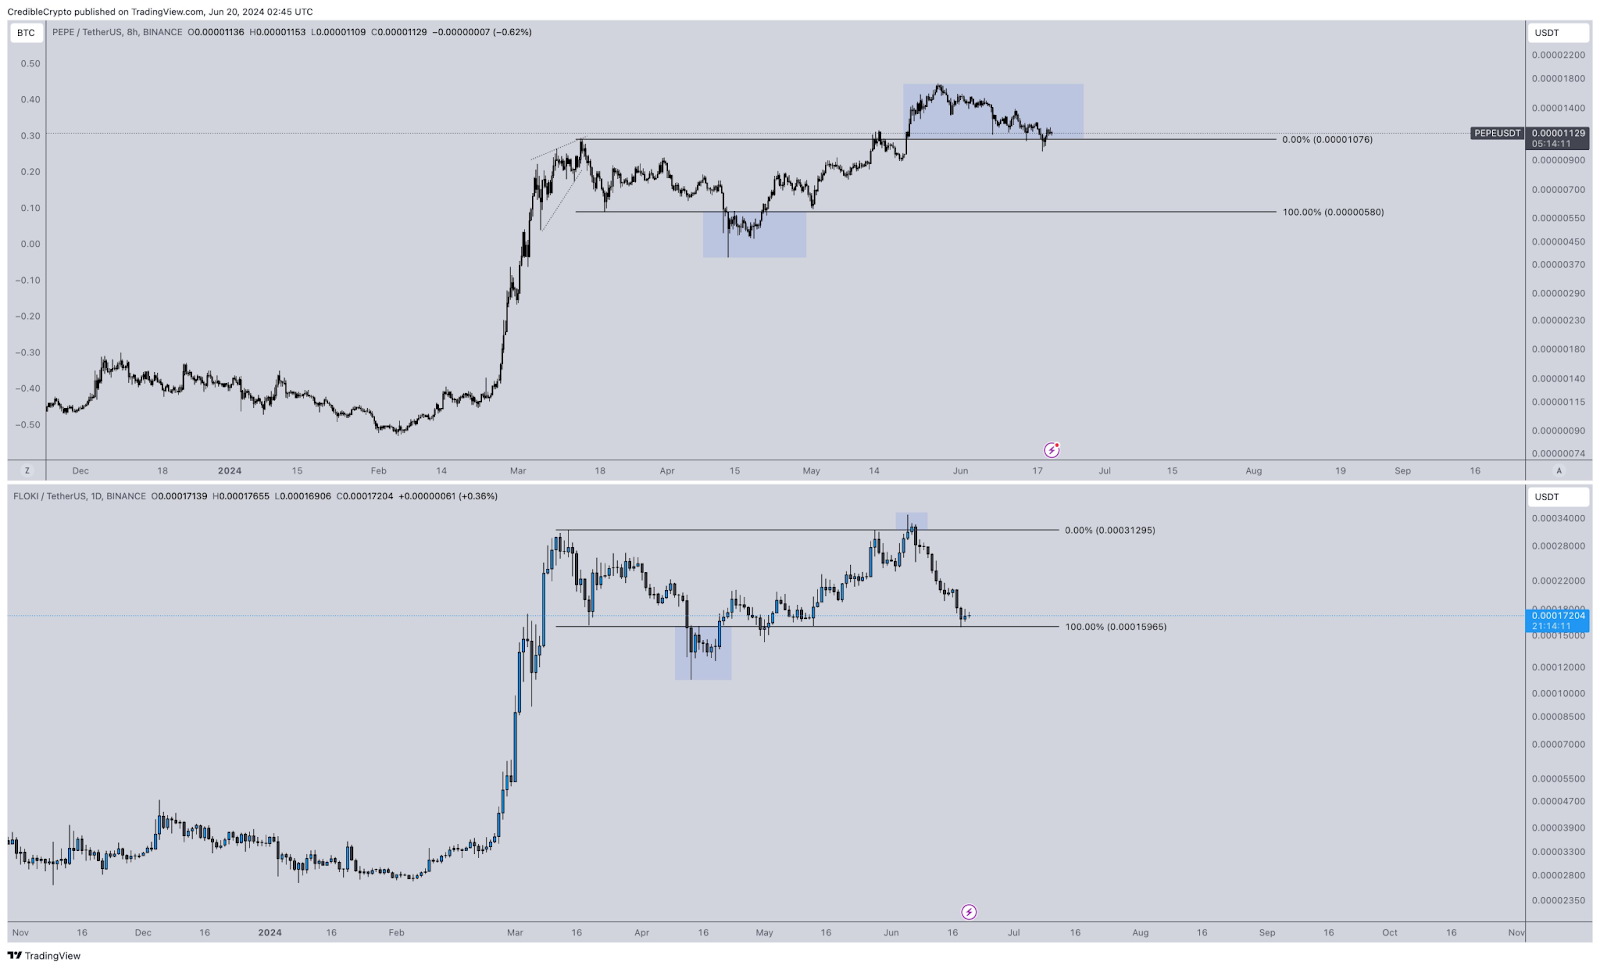
According to data from CoinMarketCap at press time, PEPE was trading at around $0.00001151, reflecting a decrease of 8.82% in the past 24 hours. This price movement aligns with CrediBULL Crypto’s prediction of a potential breakdown, suggesting that PEPE might complete a deviation/distribution pattern similar to those seen in FLOKI and BTC. This analysis indicates that PEPE could be entering a corrective phase, which might impact its short-term performance.
FLOKI, another prominent memecoin trading at approximately $0.0001751 at press time, provides a relevant comparison. The historical price trends of FLOKI show a pattern of rapid rises followed by substantial corrections.
Analyst Predicts Bearish Trends for PEPE, SHIB, and FLOKI Amid Market SlumpAfter peaking, FLOKI retraced to a significant support level near $0.00015965. This correction indicates that FLOKI has likely completed its deviation/distribution phase. This comparative analysis offers valuable insights, suggesting that PEPE might follow a similar trajectory.
The PEPE/USDT chart shows a potential breakdown pattern, indicating a likely continuation of volatility. The Relative Strength Index (RSI) for PEPE is at 44.46, suggesting that the coin is in the neutral region, but it is approaching the oversold territory, which might lead to further price declines. Similarly, the FLOKI/USDT chart highlights a significant rise followed by a corrective phase, with an RSI of 35.32, indicating that FLOKI is currently oversold and may soon experience a bounce-back.


