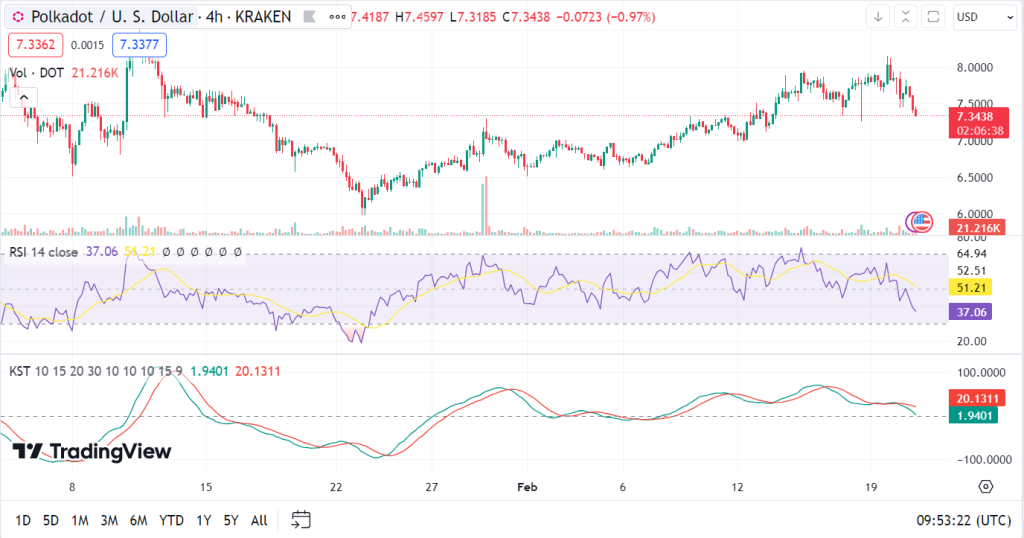
- DOT faces resistance at $7.95, hinting at complex market dynamics and potential for a b-wave top formation if it drops below $6.99.
- With a 4-hour RSI of 37.71, DOT teeters on oversold territory, suggesting a possible rebound despite current selling pressures.
- Underlying strength in DOT, as shown by 4-hour KST, could counter bearish trends and support a price reversal despite challenges.
Polkadot (DOT) has recently caught the attention of investors and analysts alike, as it faced a rejection at a crucial resistance level of $7.95, suggesting a complex interplay of market forces surrounding its value proposition. As per Morecryptoonline, an analyst, the failure of wave (3) to hit its minimum targets has led to speculation about a potential b-wave top formation, with a decisive drop below $6.99 possibly confirming this trend.
Polkadot’s live price is $7.42, marking a 5.41% decrease over the last 24 hours, with a trading volume of $366.8 million. This recent downturn has placed the DOT token in a precarious position, teetering on the brink of the oversold territory as indicated by its 4-hour Relative Strength Index (RSI) of 37.71. This metric suggests that despite the selling pressure, there could be a silver lining in the form of a price recovery soon.
Moreover, the 4-hour Moving Average Convergence Divergence (MACD) indicates continued selling pressure. However, the RSI’s trajectory towards oversold conditions might hint at a looming reversal. The 4-hour Know Sure Thing (KST) oscillator also underscores an underlying strength within the DOT token. This strength could serve as a backbone for a potential price reversal, countering the bearish signals from the MACD.

Consequently, investors and market watchers are poised at a critical juncture where the interplay between these technical indicators could unravel the next chapter in DOT’s market journey. The proximity to oversold conditions juxtaposed with inherent market strength paints a picture of a token that, despite current challenges, harbors the potential for a rebound.
Polkadot’s market activity is a testament to cryptocurrencies‘ volatile and unpredictable nature. The token’s struggle at key resistance levels and its flirtation with oversold territory set the stage for a potentially interesting market movement. Investors would do well to keep a close eye on these developments, as the confluence of RSI, MACD, and KST indicators may dictate the short-term trajectory of DOT’s market value.


