
- XRP aims to close above $0.64 to establish a new high, with key resistance at $0.6378 and $0.6487.
- The 7-period MA at $0.65716 and 25-period MA at $0.5804 are crucial for short and medium-term support.
- The MACD’s near-zero value hints at a potential bullish crossover, with XRP’s price rising 6.14% in the last 24 hours.
XRP is currently making notable strides in the cryptocurrency market, with its price aiming to close above $0.64 as highlighted by Egrag Crypto, a top analyst. This movement is critical, as it would establish a higher high compared to its previous peak at $0.63. Analyzing the XRP/USDT pair on a 4-hour chart reveals a bullish trend, highlighting the importance of monitoring current price movements and key support and resistance levels.
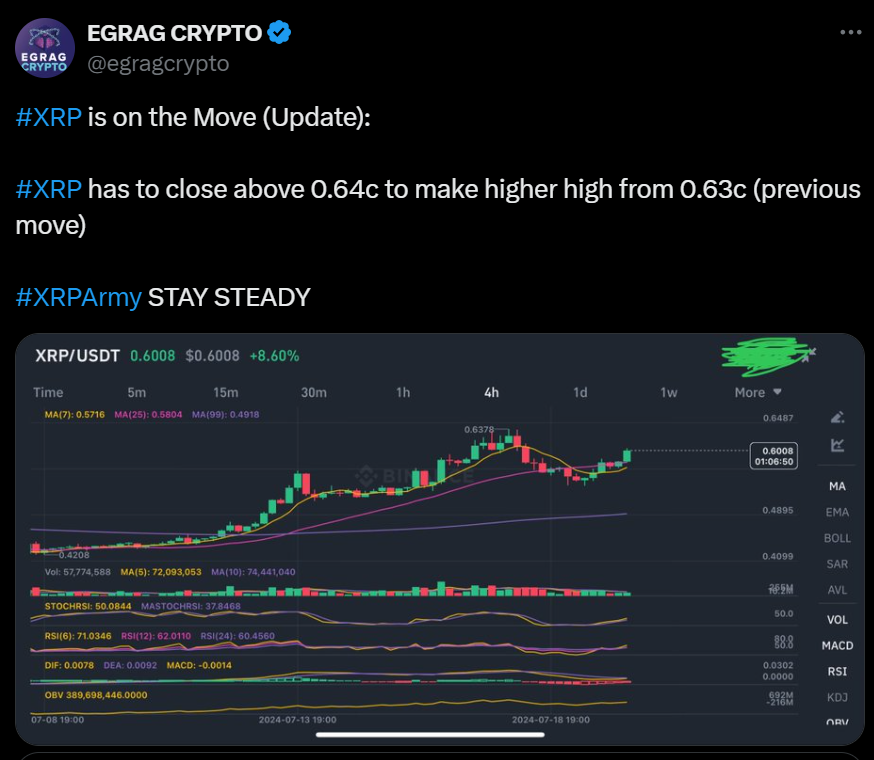
Recently, XRP has demonstrated a robust upward trend, suggesting strong bullish momentum. The 7-period moving average (MA) is positioned at $0.65716, acting as a short-term support and resistance benchmark.
In contrast, the 25-period MA, at $0.5804, serves as a medium-term indicator, while the 99-period MA, at $0.4918, provides essential long-term support. These moving averages are crucial for identifying where the price may encounter resistance or find support.
Support levels for XRP are notably significant. The price has shown strong support around $0.5804, aligning with the 25-period MA. Even more substantial support is observed at $0.4918, corresponding to the 99-period MA. Additionally, $0.4208 is a critical support level, representing the lowest point on the chart.
Conversely, key resistance levels are crucial for determining potential price movement. The highest point on the chart, $0.6378, and the resistance at $0.6487 are vital hurdles. Successfully breaking through these resistance levels is essential for maintaining the bullish trend. Failure to do so could lead to a price pullback towards the identified support levels.
Bitcoin, XRP, and Dogecoin Struggle Amidst Market Decline: What’s Next?Regarding technical indicators, the Stochastic RSI (STOCHRSI) shows a neutral value of approximately 50.0844. The Relative Strength Index (RSI) values are mixed: the 6-period RSI at 71.0346 indicates overbought conditions, while the 12-period RSI stands at 62.0110, showing a neutral to slightly overbought condition. The 24-period RSI at 60.4560 further reflects a neutral stance.
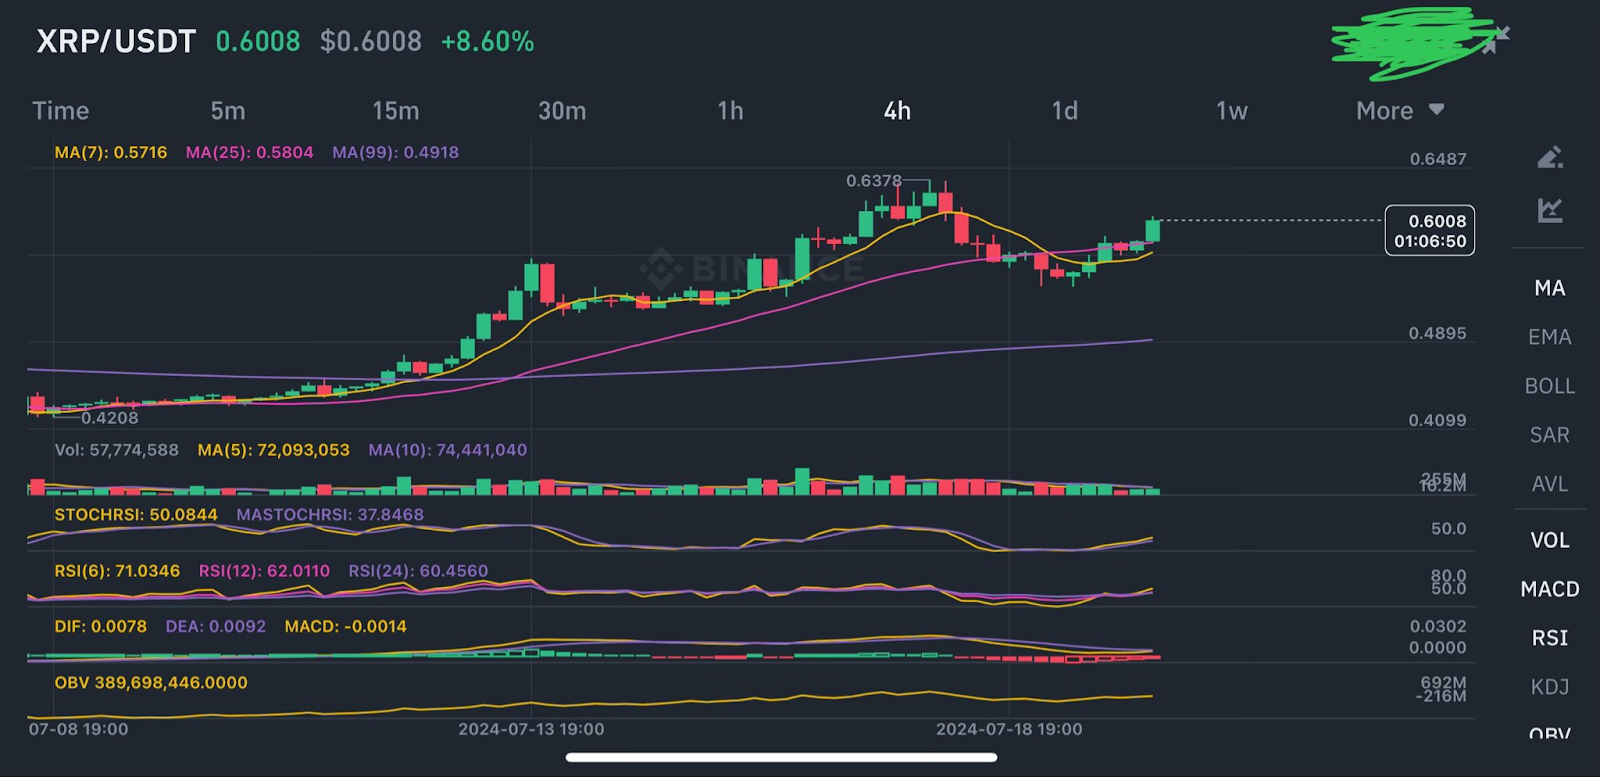
The Moving Average Convergence Divergence (MACD) also provides insight into potential bullish momentum. With the DIF value at 0.0078 and the DEA at 0.0062, the MACD stands at -0.0014. Although the MACD is currently negative, it is approaching zero, suggesting a potential crossover and further bullish movement.
At present, XRP’s price trends upward, with resistance around $0.6378 and $0.6487. Short-term support is seen at $0.5804, while long-term support is found at $0.4918 and $0.4208.
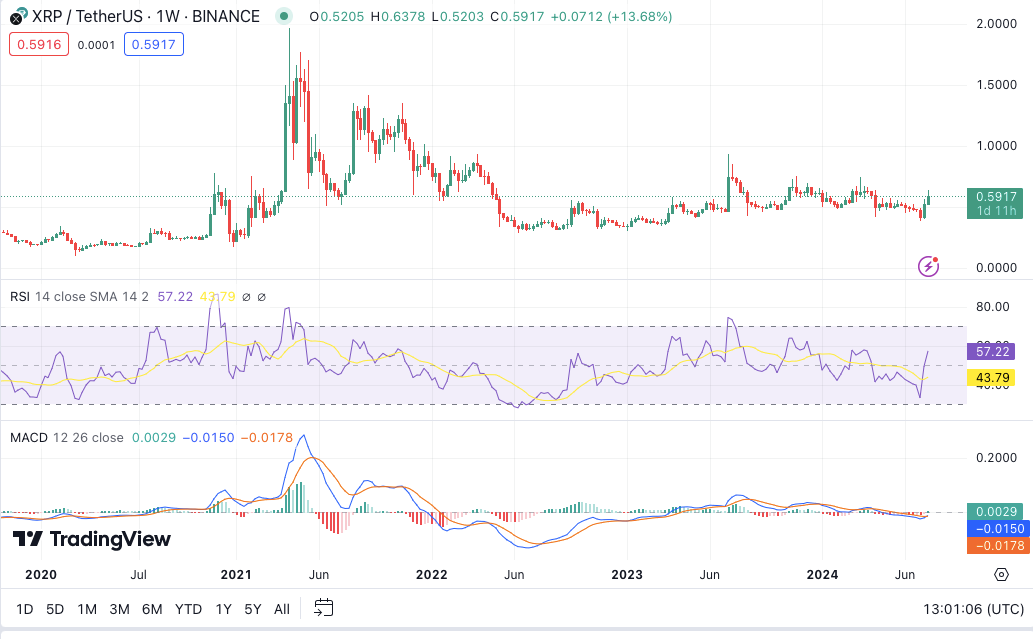
The live XRP price at press time is $0.588985, with a 24-hour trading volume of $2,142,788,424, marking a 6.14% increase in the last 24 hours. The 1-day RSI reads 65.43, indicating a slight overbought condition in the short term. Meanwhile, the 1-day MACD trading above the signal line suggests that bullish momentum is building for XRP in the near future.