


- LTC’s support near $80 and resistance at $81.84 reflect key price levels influencing market dynamics.
- Positive sentiment correlates with LTC price increases, but sustained trends require broader market support.
- Technical indicators suggest LTC’s market position is neutral, with potential for reversal and continued bullish momentum.
Litecoin (LTC) has witnessed a rollercoaster ride in its price trend over a certain period, characterized by notable fluctuations and a subsequent recovery phase. Beginning near the $81.84 mark, LTC experienced a significant downturn, plummeting below $80 before embarking on a remarkable journey back towards stability.
One of the critical aspects in analyzing LTC’s price movement is identifying its support and resistance levels. Throughout the observed period, the $80 mark emerged as a crucial support level, where the price found temporary consolidation before initiating a robust recovery. Conversely, around the $81.84 price point, resistance became evident, hindering further upward movement and signaling a shift in market dynamics.
Volume plays a pivotal role in understanding market sentiment and response. A substantial increase in trading volume, up by 44.56% from the previous period, coincided with LTC’s price recovery. This surge in volume suggests heightened buyer interest and potential for sustained bullish sentiments if the trend persists. Additionally, the volume/market cap ratio, standing at 4.80%, underscores significant trading activity relative to Litecoin’s market size.
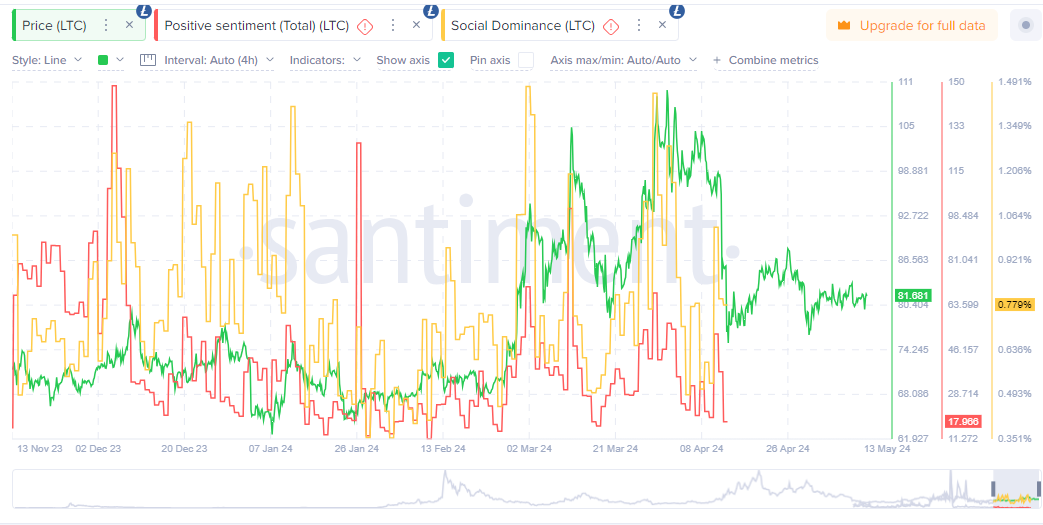
Positive sentiment, as reflected in social media and news platforms, often correlates with upward movements in LTC’s price. Spikes in positive sentiment, particularly notable in late December and early March, precede or coincide with price increases, indicating a possible causal relationship.
However, it’s crucial to note that high sentiment levels do not consistently sustain price hikes, as evidenced by subsequent sharp declines, underscoring the influence of other market fundamentals.
Social dominance, denoting the prominence of Litecoin discussions relative to other cryptocurrencies, also influences market activity. Increases in social dominance align with both price peaks and troughs, reflecting the impact of heightened attention on LTC’s price dynamics. However, the timing of peak social dominance does not always perfectly align with price movements, suggesting broader market reactions and the interplay of various factors.
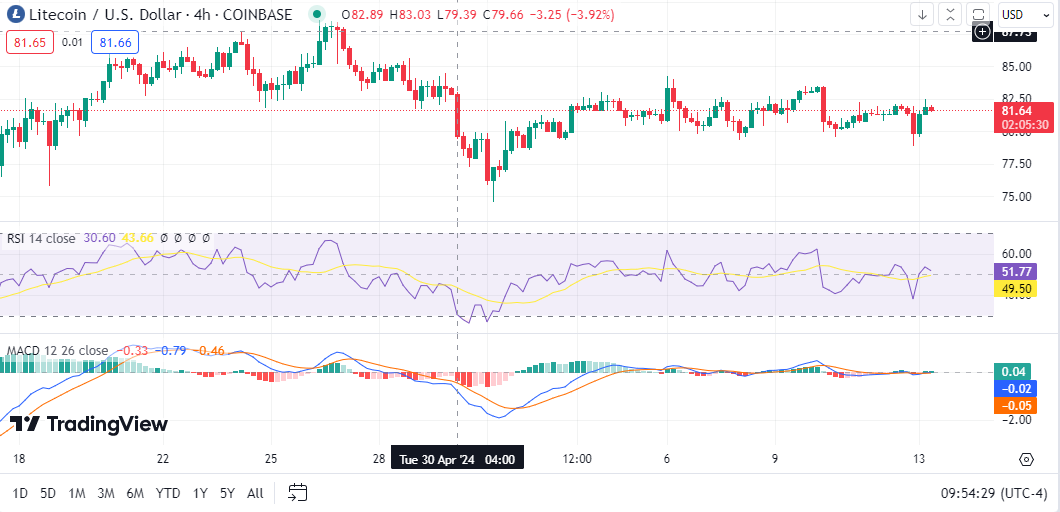
Technical indicators provide further insights into LTC’s current market position and potential future trends. The Litecoin 1-Day RSI, reading 46.72, indicates neutrality, implying the possibility of a reversal in the near term. Moreover, trading above its short-term, medium-term, and long-term moving averages signals continued bullish momentum, supported by the MACD trading above the signal line, albeit still in negative territory.


