


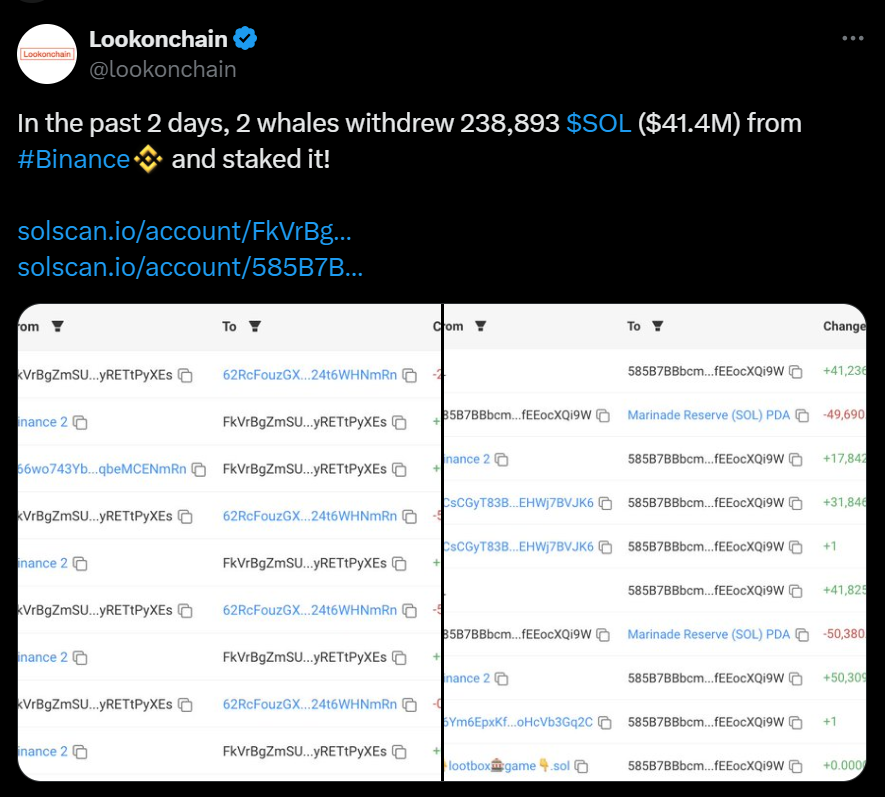
- Two whales have withdrawn $41.4M worth of $SOL from Binance, signaling potential shifts in market dynamics.
- Solana is trading at $177.59, positioning it between key resistance and support levels, indicating market uncertainty.
- With an RSI of 63.47 and the MACD above the signal line, Solana shows short-term bullish momentum.
According to Lookonchain’s recent X post, the cryptocurrency market witnessed significant movements in Solana ($SOL). The move involved two major whales withdrawing a substantial 238,893 $SOL, equivalent to $41.4 million, from Binance. This large-scale withdrawal and subsequent staking of $SOL highlight notable shifts in the market and potential impacts on Solana’s price.
At press time, Solana is trading at $177.59, with a 24-hour trading volume of $2.98 billion. This recent activity suggests a complex market sentiment, influenced by various factors including technical indicators and key support and resistance levels.
The price chart of $SOL/USDT exhibits a volatile pattern characterized by distinct phases of market sentiment. Historically, the cryptocurrency has experienced several critical phases. Initially, during the Euphoria Phase, prices peaked around $230. This high point, driven by intense market optimism, often leads to overvaluation as buyers exhibit excessive enthusiasm.
Following this peak, the market entered the Complacency Phase, with resistance observed around $200. However, this level has historically been unable to sustain the price, resulting in a decline.
Will Solana Raise or Fall? The Mixed Signals of ChartsAs per the analysis, $SOL is trading near $134.18, situated between the Complacency and Anxiety Phases. This positioning indicates a market caught between uncertainty and potential support zones.

The Anxiety Phase, observed around $115, represents a crucial support level where anxious investors might look for opportunities to buy and prevent further declines. Further down, the Key Support Zone at approximately $79 and the Major Support at $60 are seen as stronger levels where buying interest could potentially stabilize the price.
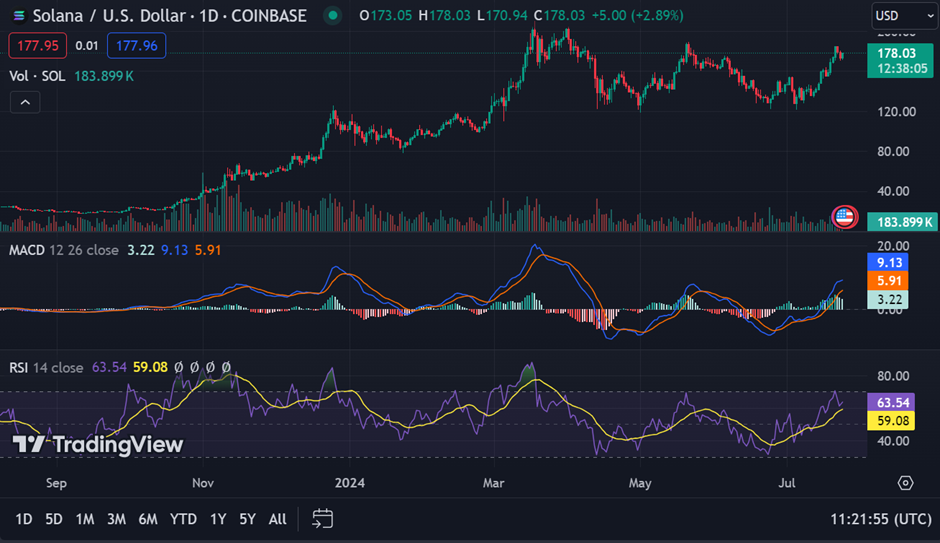
The current technical indicators offer additional insights. Solana’s 1-day Relative Strength Index (RSI) reads 63.47, placing it in a neutral position. This suggests that $SOL is neither overbought nor oversold at present. Furthermore, the 1-day Moving Average Convergence Divergence (MACD) is trading above its signal line, indicating bullish momentum in the short term.


