- Experts forecasted MANTA’s 10% surge, citing bullish signs like a weakening red candle and a double bottom pattern.
- MANTA’s green candle breakout on the 4h chart indicates a potential reversal of its downtrend, as per CryptoBusy’s analysis.
- With strong support at 2.49 USDT, MANTA shows promising signs of continued growth, including a projected 9.55% profit target.
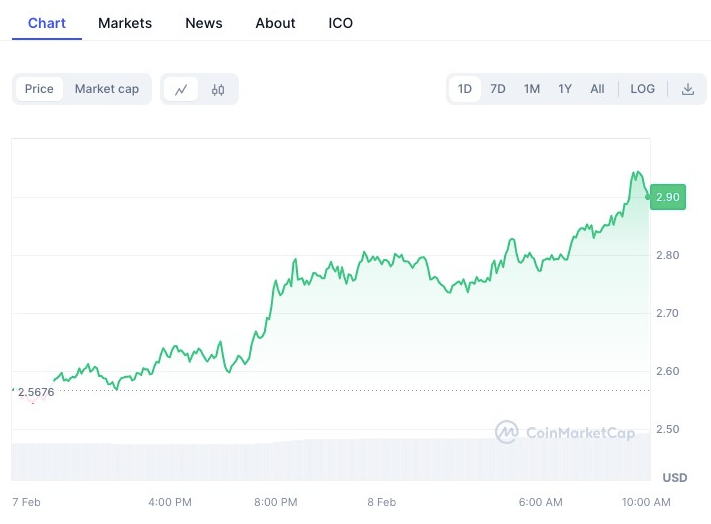
MANTA recently recorded a significant increase of over 10%, a movement anticipated by CryptoBusy eight hours earlier. This upward trend is supported by key technical indicators on the 4-hour chart, including the weakening of a red candle, the presence of bullish divergence, and the formation of a double-bottom pattern, all suggesting a potential shift in market sentiment and a favorable turn in MANTA’s price trajectory.
CryptoBusy’s 4-hour chart analysis of MANTA against TetherUS (USDT) reveals a fascinating trend. A descending trendline, drawn in white, highlighted the ongoing downtrend. However, the scenario took a bullish turn recently highlighting the market volatility.
The chart showed a crucial support level at 2.49 USDT. This level acted as a springboard, with the price bouncing back twice. These bounces are marked by yellow arrows, pointing towards a strong support foundation. Moreover, a significant green candlestick pierced through the descending resistance. This breakout candle suggests a shift in market dynamics.
Besides the bullish indicators, the chart hinted at a profit target. Positioned to the right, a box outlined a potential gain of 9.55% from the breakout point. This target sits at 0.24457 USDT, above the base of the green candle.
Consequently, traders are eyeing this development closely as a successful breakout could propel the price further. However, a retest of the broken trendline is a common market behavior hence caution remains alongside the optimism.
Additionally, Manta’s recent 24-hour performance strengthens the bullish outlook. The price stood at $2.92, with a notable trading volume of $183,176,208. The network itself has seen a 14.75% uptick in the last day.

Significantly, the analysis by CryptoBusy brings together multiple bullish signals. These include the weakening red candle, a bullish divergence, and a double bottom pattern. Each of these elements contributes to a compelling narrative for potential upward momentum.
Additionally, the market’s response to this breakout holds significant importance. Investors and traders are closely monitoring the subsequent developments. The sustainability of Manta‘s bullish momentum and the possibility of a retracement are under scrutiny. Time will ultimately reveal the outcome, yet the indications hint at a promising market trajectory for Manta.


