
- On the brink of a trend shift, MATIC approaches critical resistance, hinting at a major move.
- With RSI peaking, MATIC could be headed for a price correction, warranting trader vigilance.
- A bullish MACD positions MATIC as a contender for timely investment opportunities.
Polygon (MATIC), a prominent player in the cryptocurrency market, is currently under the spotlight as it approaches a pivotal resistance level that has been tested over a span of 682 days. Investors and traders are on high alert, anticipating significant price movements should Polygon break through this long-standing barrier.
Moreover, the potential for a breakout underscores the importance of proactive market monitoring. Consequently, setting price alerts for MATIC can be an astute strategy for those looking to capitalize on any upward trajectory.
As Polygon (MATIC) approaches a critical resistance level that it has been testing for 682 days, a significant price movement is anticipated if a breakout occurs. CryptoBusy, an analytics platform, recommends setting a price alert for MATIC to track possible surges. They also advise traders to observe lower timeframes for shorting prospects if the resistance holds.
WATCH OUT FOR THIS #POLYGON $MATIC MULTI-YEAR RESISTANCE! 🚨
— CryptoBusy (@CryptoBusy) November 6, 2023
682 days – Massive movement if it breaks out! 📈
What you can do is set up an alert if the price crosses above the resistance so you can catch the move.
However, I will also look for a shorting opportunity in case it… pic.twitter.com/fMuIzfuaHY
Additionally, the technical analysis landscape offers a dual perspective. Despite the optimism surrounding a possible breakout, there’s a contingency of investors scouting for shorting opportunities, should Polygon face rejection at this crucial juncture. Hence, vigilance over lower timeframes becomes imperative, providing a granular view of market behavior and enabling swift decision-making.
The significance of Polygon’s technical indicators cannot be overstated. Currently, its Relative Strength Index (RSI) stands at 70.67, which traditionally suggests that MATIC is in overbought territory. This implies a potential price correction may loom on the horizon.
Conversely, the Moving Average Convergence Divergence (MACD) indicates a bullish trend, painting a more positive picture of its market position. Notably, when the MACD crosses above the signal line, it often signals a buying opportunity to traders.
Furthermore, the examination of Polygon’s Exponential Moving Averages (EMAs) reveals an uptrend in the short term, as the 50 EMA outpaces both the 100 and 200 EMA. This aligns with the bullish sentiment suggested by the MACD. However, it’s critical to acknowledge that EMAs are inherently lagging indicators and are most effective when combined with other analysis tools.
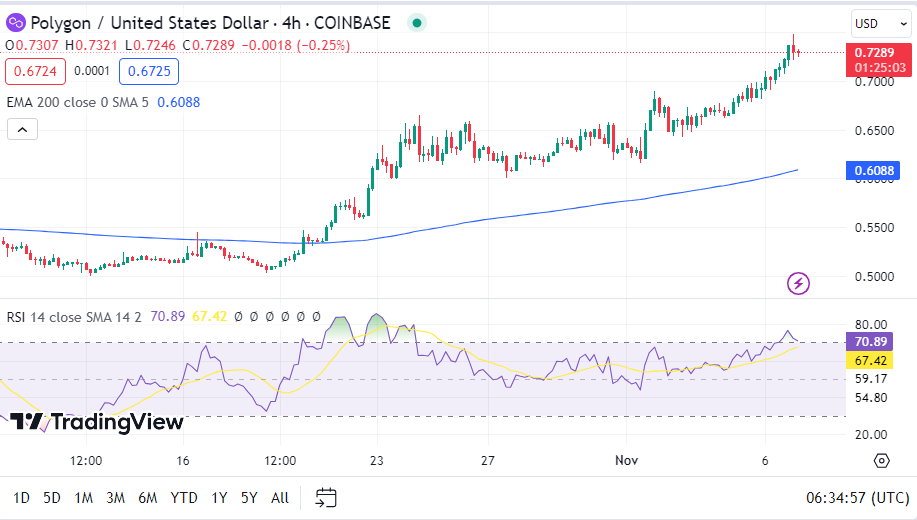
Polygon’s market standing is robust, with a market capitalization of $6.74 billion and a 24-hour trading volume of $311.03 million. The live price of MATIC sits at $0.729349, reflecting a 5.24% increase in the last 24 hours.
With a circulating supply of 9.24 billion units, MATIC’s market presence is substantial, bolstering its long-term technical score, which surpasses 48% of cryptocurrencies in circulation. This metric is particularly relevant for buy-and-hold investors, suggesting that Polygon might be a solid addition to a growth-oriented portfolio, especially for those seeking to buy the dip .
The digital currency’s market behavior presents a complex yet compelling narrative. Investors must weigh technical signals, market trends, and emerging patterns to navigate the terrain effectively. The anticipation surrounding Polygon’s potential resistance breakout contributes to an exciting chapter in the cryptocurrency saga, one that demands both strategic foresight and readiness to act.