- MATIC emerges as a standout contender amid market fluctuations, signaling a potential rally with a bullish reversal pattern.
- Exhibiting a rounding bottom pattern accompanied by increased trading volumes, MATIC hints at potential upward movement.
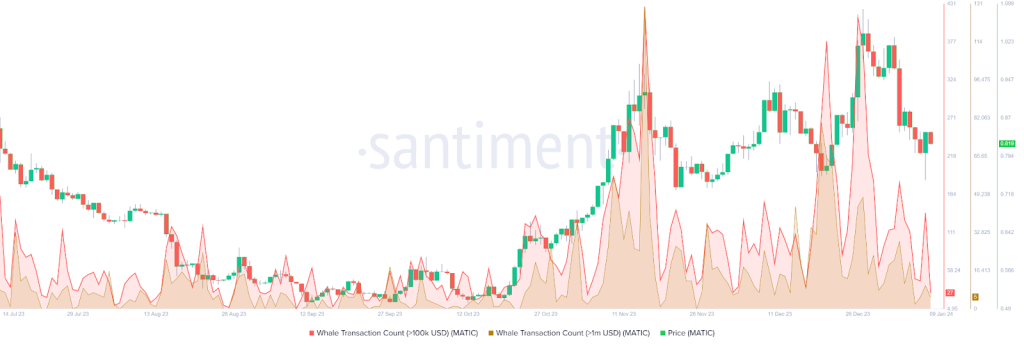
- Santiment’s analysis reveals a decline in whale volume, crucial in price dynamics, hinting at a possible bullish upswing for MATIC.
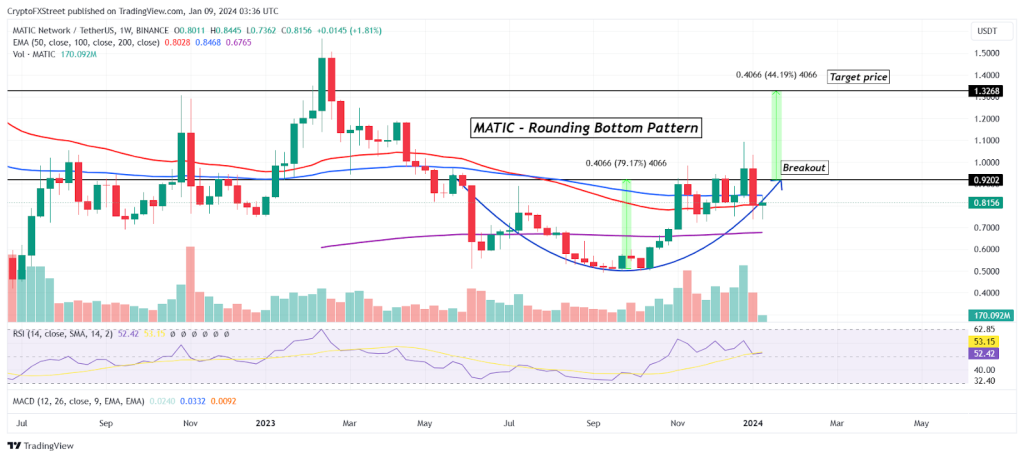
In recent market fluctuations, Polygon’s native token, MATIC, emerges as a standout contender for a potential rally in the coming weeks. Analyzing the weekly chart, MATIC showcases a macro bullish reversal pattern, indicating the prospect of surging to an 11-month high.
MATIC is currently exhibiting a rounding bottom pattern, renowned for its bullish reversal implications. This pattern unfolds when price declines coincide with significant trading volumes, followed by a period of stagnation characterized by both a price slump and a decline in trading volume.

A recovery period emerges following this phase, denoted by heightened trading volumes. Breaking above the price point preceding the initial decline could trigger a potential rally equivalent to the rounding bottom’s height.
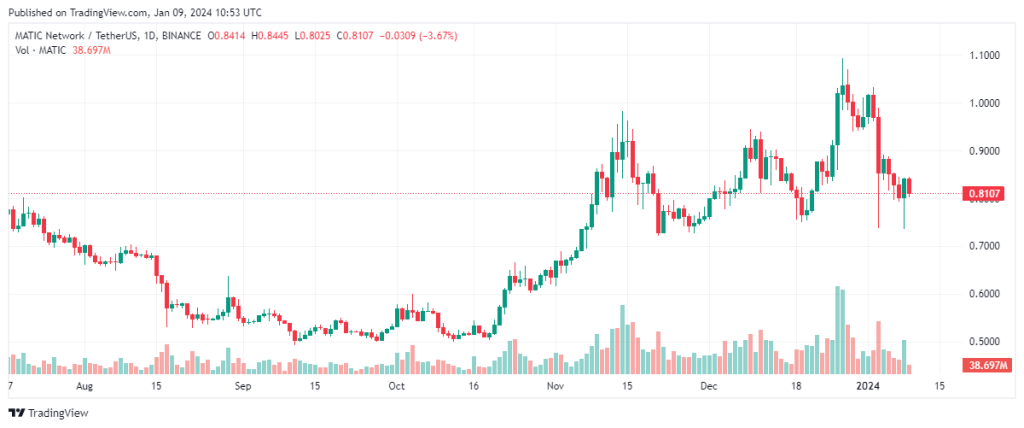
MATIC’s descent commenced in late May 2023, bottoming out at $0.50 in mid-September. The altcoin embarked on a recovery trajectory, nearly stabilizing around the $0.92 breakout level, serving as support in the prior weeks. Nevertheless, recent corrections in the crypto market caused MATIC to retract, and it is currently hovering at current price levels. MATIC is trading at $0.81, registering a 4.64% increase in the last 24 hours and a 20.70% decline over the past week.

However, caution looms as MATIC trades closely near the $0.70 stop loss. A dip below this level could invalidate the bullish scenario, leading to a potential decline towards the 200-day Exponential Moving Average (EMA) at $0.68.
Notably, insights from the renowned on-chain analytical platform Santiment highlighted a low whale volume, indicating reduced activity among significant addresses. These addresses, pivotal in price action, could reignite a bullish reversal. Their activity, dwindling since December, currently stands at a monthly low, warranting close monitoring to ascertain MATIC’s potential for a renewed rally.

The target price projection for the Polygon token stands at $1.32, reflecting a potential 44% surge above the breakout level. This bullish outlook aligns with the Relative Strength Index (RSI) positioning above the neutral 50.0 mark, indicating a bullish market sentiment. A successful breach of the $0.92 mark could pave the way for this anticipated rally.


