
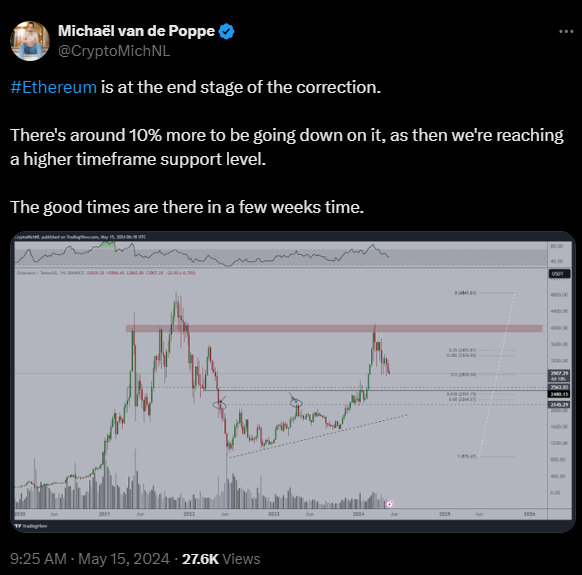
- Ethereum’s current price correction may be nearing its end, signaling potential upside.
- Key resistance levels around $3,400-$3,600 could challenge Ethereum’s upward movement.
- Support levels at $2,480 and $2,000 provide crucial stabilization points during downturns.
Ethereum is currently navigating a crucial phase in its price action as highlighted by Michaël van de Poppe, a top analyst. With recent fluctuations indicating a potential correction nearing its end, investors are eyeing forthcoming weeks with cautious optimism.
Trading at $2,900.97 the journey of Ethereum’s price against the US Dollar has been characterized by volatility, showcasing significant highs and lows over time. In 2021, Ethereum surged to remarkable highs, breaching the $4,800 mark before facing a substantial downturn in 2022, stabilizing around $1,000. A subsequent recovery phase ensued, propelling prices to around $3,600 in early 2024, followed by another downturn.
Analysts point out key resistance and support levels to gauge Ethereum’s potential trajectory. The primary resistance area, spanning approximately $3,400 to $3,600, has historically posed a formidable barrier, leading to price retracements. Additionally, a higher resistance zone around $4,800 marks a critical psychological barrier for the market, having been tested only once.
On the flip side, multiple support levels have been identified, offering potential stabilization points during downward movements. The immediate and robust support lies around $2,480, corresponding to the 0.618 Fibonacci level, with another crucial support at approximately $2,000, aligning with historical price behaviors.
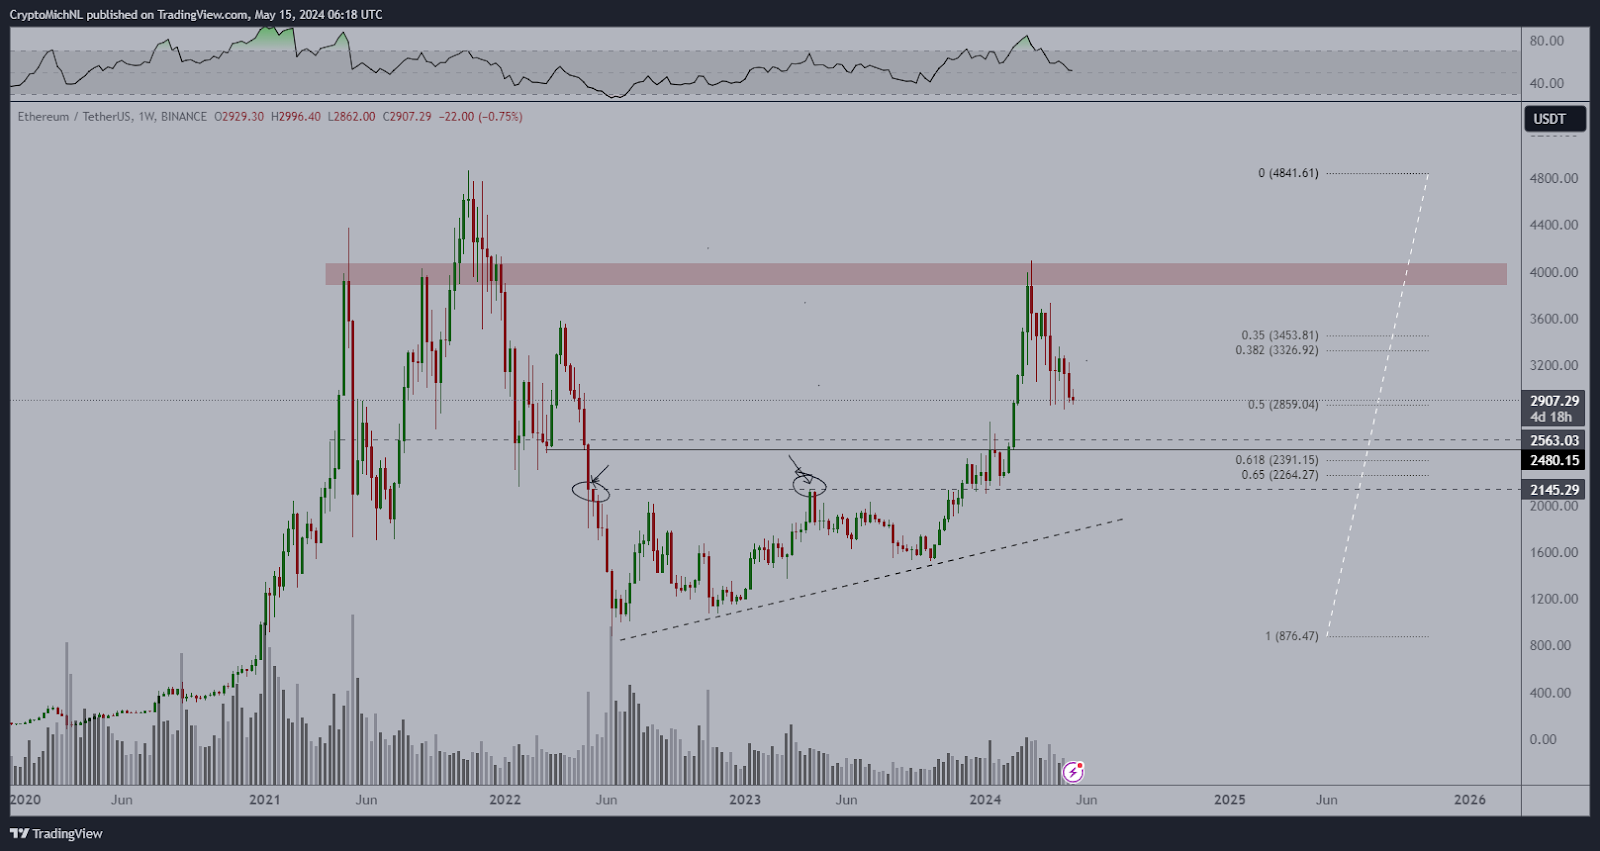
Fibonacci retracement analysis supplements this understanding, providing intermediate points where prices could potentially stabilize or reverse. The 0.382 and 0.5 levels offer additional insights into potential price movements.
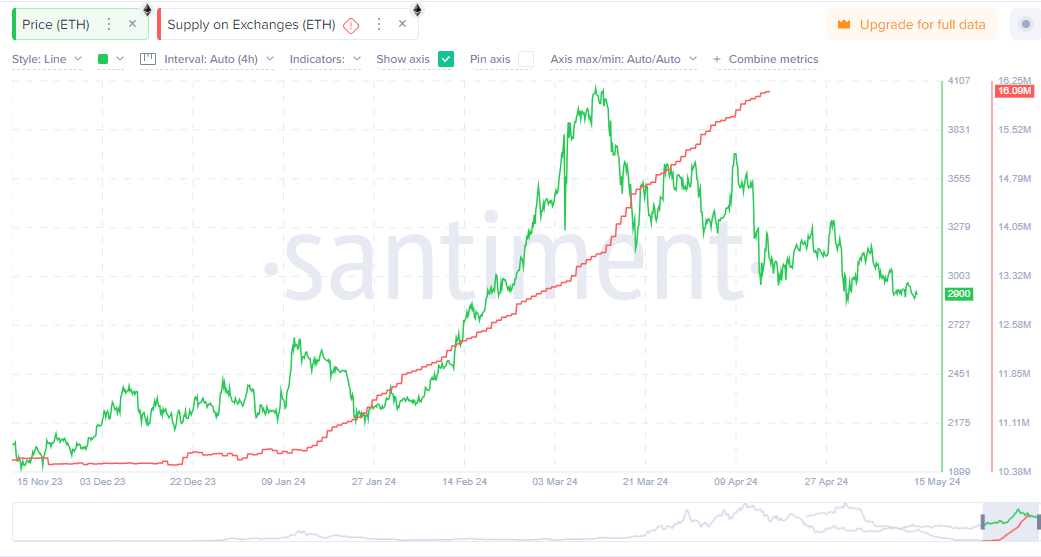
Correlation analysis between Ethereum price and supply on exchanges sheds light on market dynamics. Periods of subdued movements in both indicate a balanced market state, while sharp price increases correspond with heightened supply on exchanges, potentially driven by profit-taking or increased trading activity.
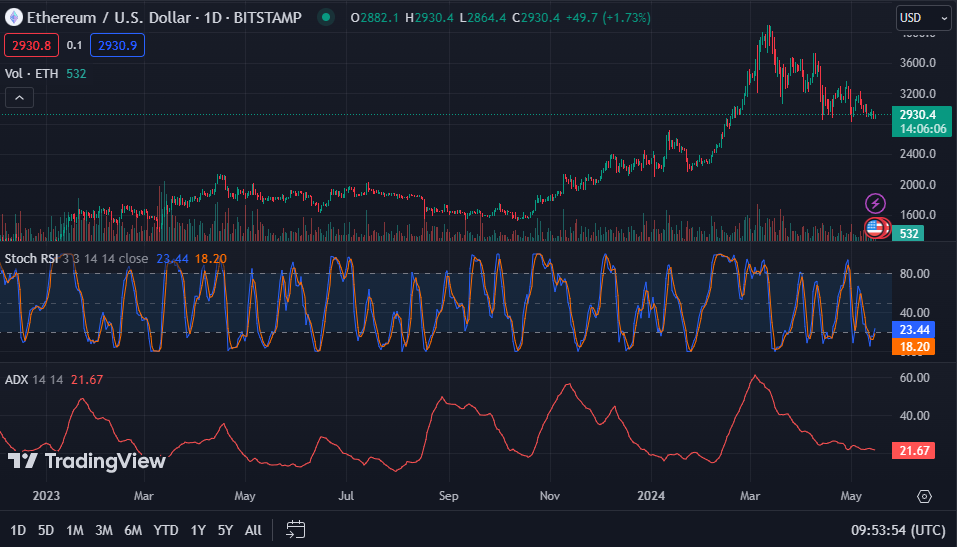
Technical indicators, such as stochastic RSI and MACD, offer further insights into Ethereum’s short-term momentum and potential price reversals. While oversold conditions suggest a possible reversal, bearish momentum indicates caution, with the ADX signaling a lack of strong trend in either direction.


