


- ROSE is running at more than 40% profit and is expected to surge above 50%.
- Recent market activities suggest ROSE has transitioned from a bearish to a bullish stance.
- Stability around $0.11 despite past volatility sets the stage for a promising bullish trend.
Oasis Network (ROSE), a pioneering layer 1 blockchain, is poised for a significant surge, according to renowned crypto analyst Clifton Fx. The latest trading data on charts shows ROSE transitioning from a downtrend to an optimistic bullish wave, signaling robust market interest.
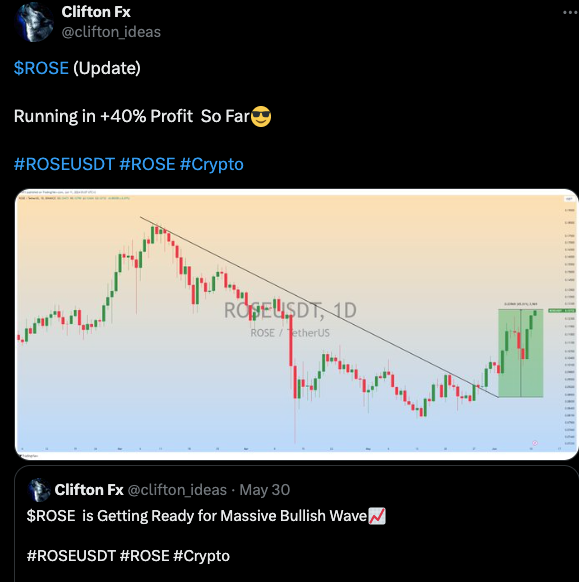
Following months of declining trendline, the ROSE/USDT has recently broken through critical resistance. This shift was evident in early June when the trading pair surpassed a long-standing descending line. Such movements are typically bullish indicators, suggesting a potential uptrend.
Clifton Fx’s analysis on TradingView pinpoints this breakout as a crucial turning point. A recent surge in trading volume and price suggests ROSE could rise by over 50% in the coming weeks. This is a significant reversal from its previous position, where it struggled to rise above $0.09 amidst market volatility.
Investors show increased confidence in ROSE, buoyed by broader market recoveries and a growing interest in alternative cryptocurrencies. This shift is reflected in the green candlesticks within the newly established bullish zone, underscoring a positive momentum shift.
Top AI and Big Data Crypto Tokens: NEAR, ROSE, and GLM Take Center StageOver the past week, the Rose price has surged more than 2.47%, indicating a bullish trend. However, over the past few hours, the price has experienced a slight dip. Oasis is trading at $0.1154, down 0.59% in the last 24 hours. The market cap is $777.18 million, reflecting a 0.64% decrease.
The 24-hour trading volume has surged by 55.12%, reaching $89.05 million. The circulating supply of ROSE is 6.71 billion, with a total supply of 10 billion. Despite the recent dip, the trading activity suggests a robust interest in Oasis.
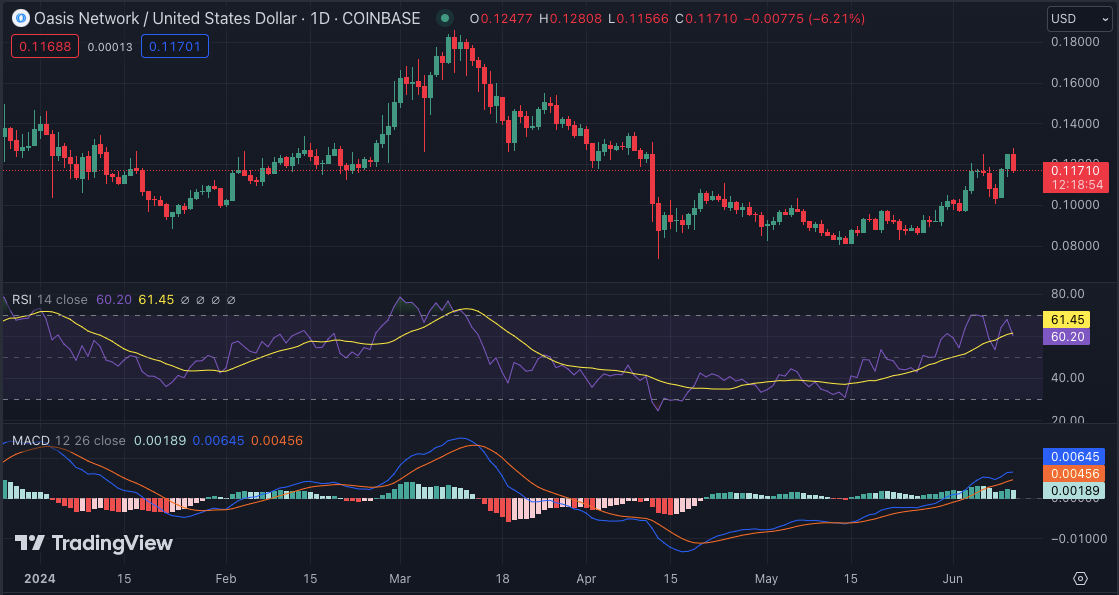
The daily technical indicators for Oasis Network (ROSE) on the 1D chart show significant price movements. The Relative Strength Index (RSI) stands at 60, indicating a slightly overbought condition. The Moving Average Convergence Divergence (MACD) shows a histogram of 0.00192, with the signal line at 0.00457, hinting at potential bullish momentum.


