
Ondo (ONDO) showcases a significant upward trend in its latest price movements. Analyzed by crypto expert Captain Faibik on X post, the ONDO daily chart highlights a symmetrical triangle pattern. This pattern, from early March to late May, suggests a consolidation phase following a strong uptrend that started in February.
The price of ONDO recently broke out from this pattern. In early June, it surged reaching a high of $1.31. This marks a strong bullish sentiment and forecasts further upward movement.
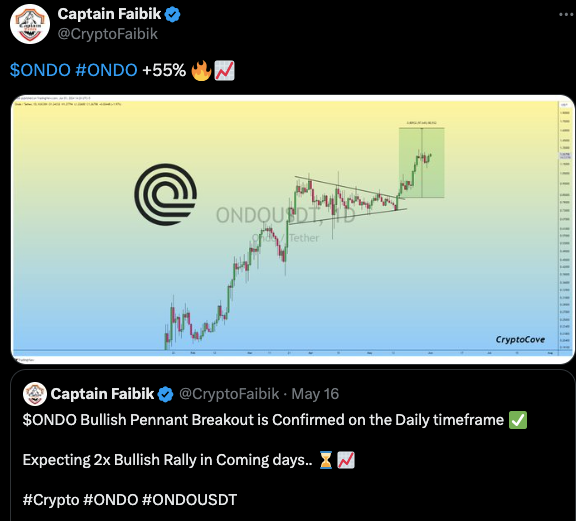
Technical analyst Faibik sees this breakout as a strong buy signal, often backed by high trading volumes and positive market sentiments. A similar bullish pattern, a pennant, was confirmed on the daily timeframe, signaling further bullish potential.
In a recent analysis, Captain Faibik highlighted a crucial breakout point for the ONDO/USDT trading pair. Following a consistent convergence of price highs and lows, this breakout occurred above the triangle’s upper trend line, hinting at a bullish outcome.
Analyst Predicts Further Gains for BLUR and ONDO Tokens After Key BreakoutsThe target set by the green rectangle in the analysis projects a price increase of approximately 97.64% from the breakout point, aiming for around $0.80932. This forecast relies on continued buying pressure and a generally bullish market sentiment.
Over the past 24 hours, the price of Ondo (ONDO) has shown a positive uptick, increasing by 3.13% to reach $1.28. This rise marks a significant recovery noted in the early hours of trading.
Ondo’s market capitalization is now approximately $1.775 billion, positioning it at 59th in global cryptocurrency rankings. The trading volume for Ondo has surged by 15.20%, totaling over $200 million in the last day. This volume increase reflects a growing interest among traders in Ondo.
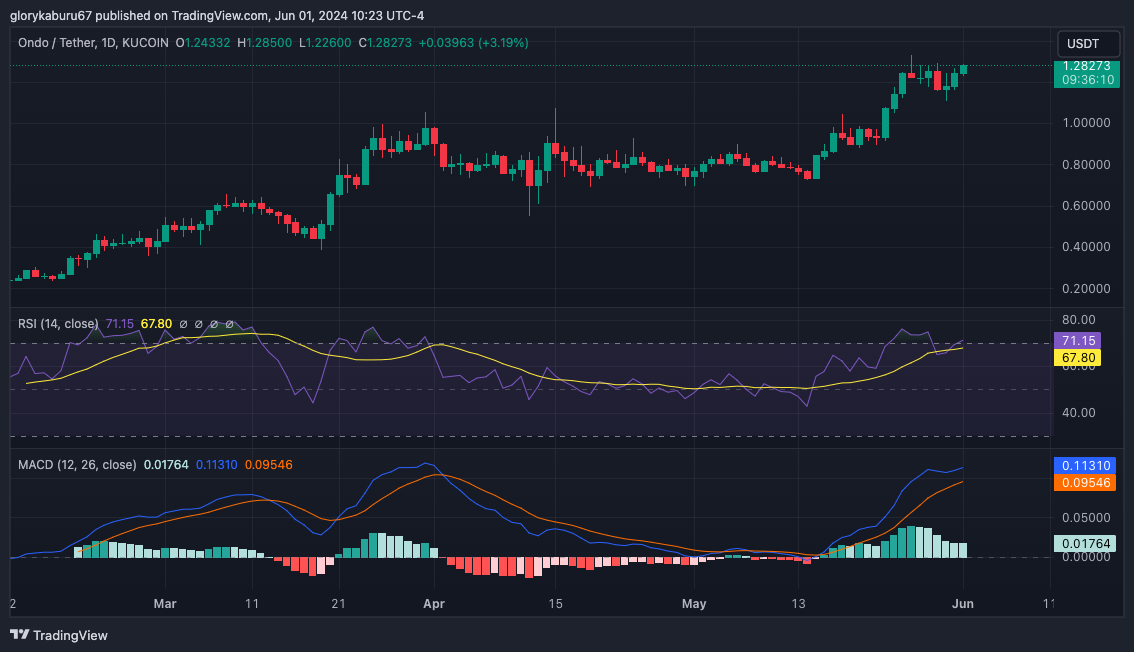
The daily technical chart for Ondo (ONDO) shows a positive trend. The candlestick chart indicates a steady upward movement, with the price breaking past recent resistance levels.
The Relative Strength Index (RSI) stands at 71.15, indicating the overbought territory, which suggests a bullish trend for the token. The Moving Average Convergence Divergence (MACD) shows a bullish signal with the MACD line above the signal line, supported by positive histogram bars.