
- Growing liquidity in crypto hints at potential volatility as unallocated capital waits.
- Stablecoin surge reflects capital influx, but buying pressure on assets remains muted.
- Institutional strategies and unallocated funds suggest possible sharp market movements.
According to a crypto firm data on X, the cryptocurrency market has witnessed a significant surge in liquidity in recent weeks. Despite the increasing capital, it still needs to be allocated, leaving the market ready for potential shifts.
A notable increase of over $3.65 billion in stablecoin USDT supply in the last 30 days reflects a broader trend of external capital entering the crypto space. Despite the influx, the expected buying pressure on order books still needs to be improved, indicating that the market’s full potential is yet to come.
The increase in USDT capitalization indicates a more significant allocation of traditional market assets into cryptocurrency. To issue a new USDT, collateralization with goods and assets from outside the crypto market is necessary.
This process underscores the deepening ties between the traditional financial system and the crypto market, with stablecoins like USDT yielding as the primary proxy for the U.S. dollar within the digital asset ecosystem.
Despite the growing liquidity, immediate demand for digital assets is yet to materialize. This delayed response suggests that much of the capital allocated to stablecoins needs to exert more buying pressure.
However, this “firepower” remains reserved, ready to be deployed anytime. If and when this capital enters the market, it could lead to substantial price shifts, especially if large amounts enter abruptly.
Moreover, institutional investors’ involvement adds another layer of complexity. These investors may use TWAP (Time-Weighted Average Price) orders or algorithms to accumulate digital assets.
They minimize the impact on short-term prices by spreading out their purchases over time. This strategy allows them to enter the market discreetly, reducing the risk of triggering sharp price fluctuations.
Bitcoin Liquidity Zones Indicate Key Levels Amid Market ChopOn the other hand, the current market indicators for Bitcoin present a mixed outlook. The cryptocurrency’s price is hovering around $56,512.98, with a 24-hour trading volume of over $31 billion. However, Bitcoin has seen a 4.56% decline in the last 24 hours.
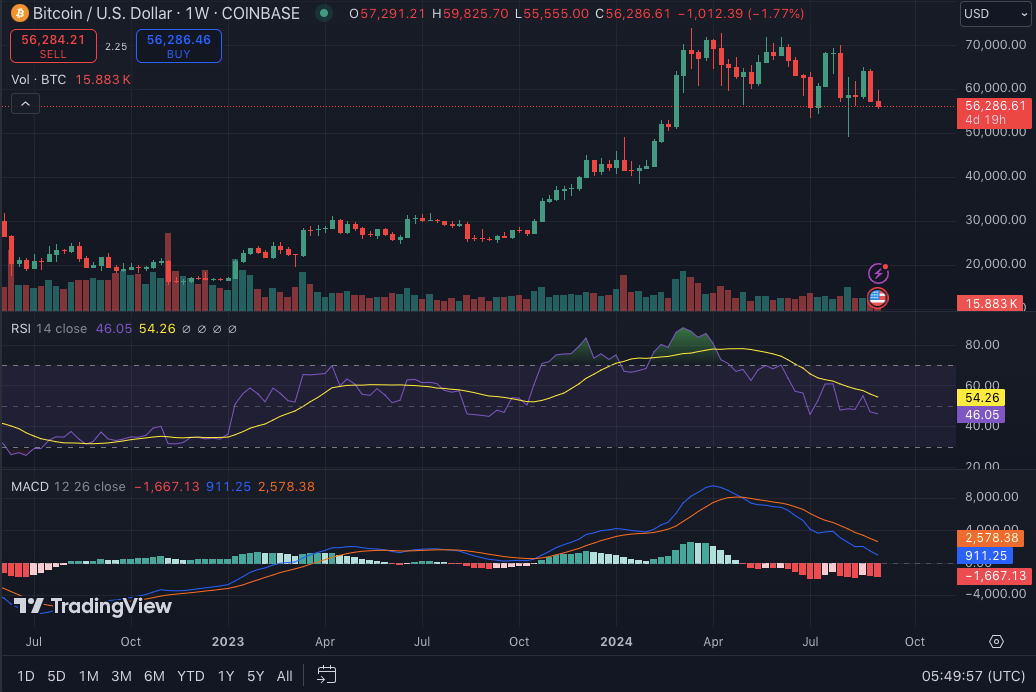
The 1-week RSI stands at 46.14, signaling that Bitcoin is neither overbought nor oversold. However, the 1-week MACD is trading below the signal line, hinting at a potential bearish trend in the short term.
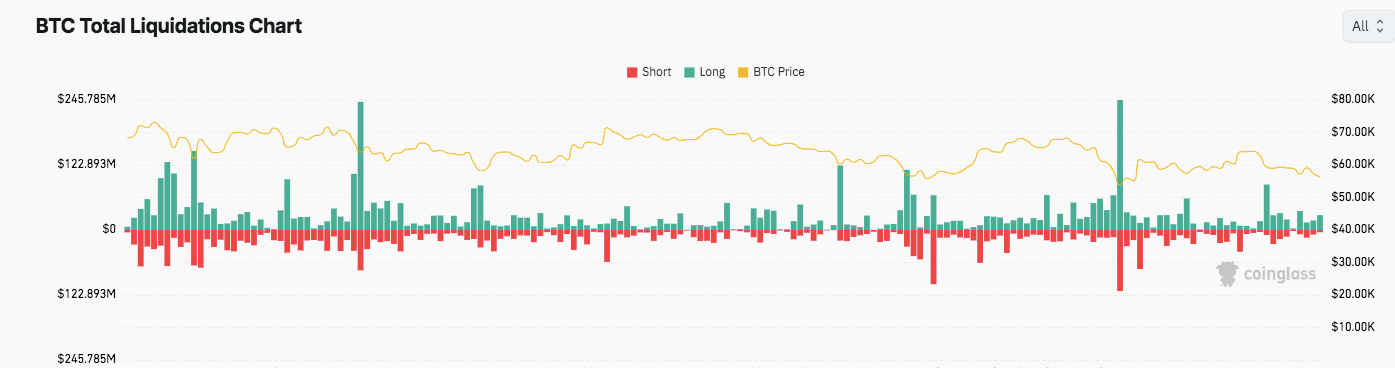
Additionally, the BTC Total Liquidations Chart highlights a significant trend in the market. It reveals liquidation spikes during heightened volatility, particularly during sharp price movements. These spikes indicate that traders, often leveraging their positions, are caught off guard by sudden market changes. Moreover, the chart shows that liquidations occur more frequently on the downside, reflecting the market’s speculative and highly leveraged nature.