


- PEPE’s bullish pennant on the 4-hour chart hints at a possible breakout towards $0.00001650 if resistance breaks.
- Key support levels for PEPE are $0.00001190 and $0.00001030; a drop below may lead to a decline.
- Current indicators show PEPE’s RSI at 54.59 and MACD above the signal line, suggesting potential short-term bullish momentum.
The PEPE meme coin is showing promising technical signs on the 4-hour chart, hinting at a potential bullish breakout as highlighted by Clifton Fx, an analyst. Currently, PEPE/USDT is forming a bullish pennant formation, a pattern that often follows a strong upward move and signals further gains ahead. This technical setup is characterized by converging trend lines that create a triangular shape, suggesting that a breakout could lead to significant price movement.

The immediate focus is on the key support and resistance levels surrounding this pattern. The lower trend line of the pennant provides a crucial support level around $0.00001190. This support is vital for maintaining the integrity of the bullish pattern.
Analyst Questions Further PEPE Investment Amidst VolatilityShould the price drop below this level, it may invalidate the bullish scenario and lead to a potential decline. Another important support level is located at $0.00001030, marked by a recent swing low.
On the flip side, the upper trend line of the pennant serves as the primary resistance, currently at approximately $0.00001235. A successful breakout above this resistance level could trigger a substantial price rally.

The bullish pennant formation suggests that the price might advance towards a target of $0.00001650. This target is based on the height of the flagpole preceding the pennant, indicating a projected move of around 36.60%.
Moreover, the current market dynamics support this optimistic outlook. The PEPE price stands at $0.000012, with a substantial 24-hour trading volume of $673,389,338. Although PEPE has experienced a slight decline of 2.31% over the past 24 hours, the technical indicators provide a mixed yet hopeful perspective.
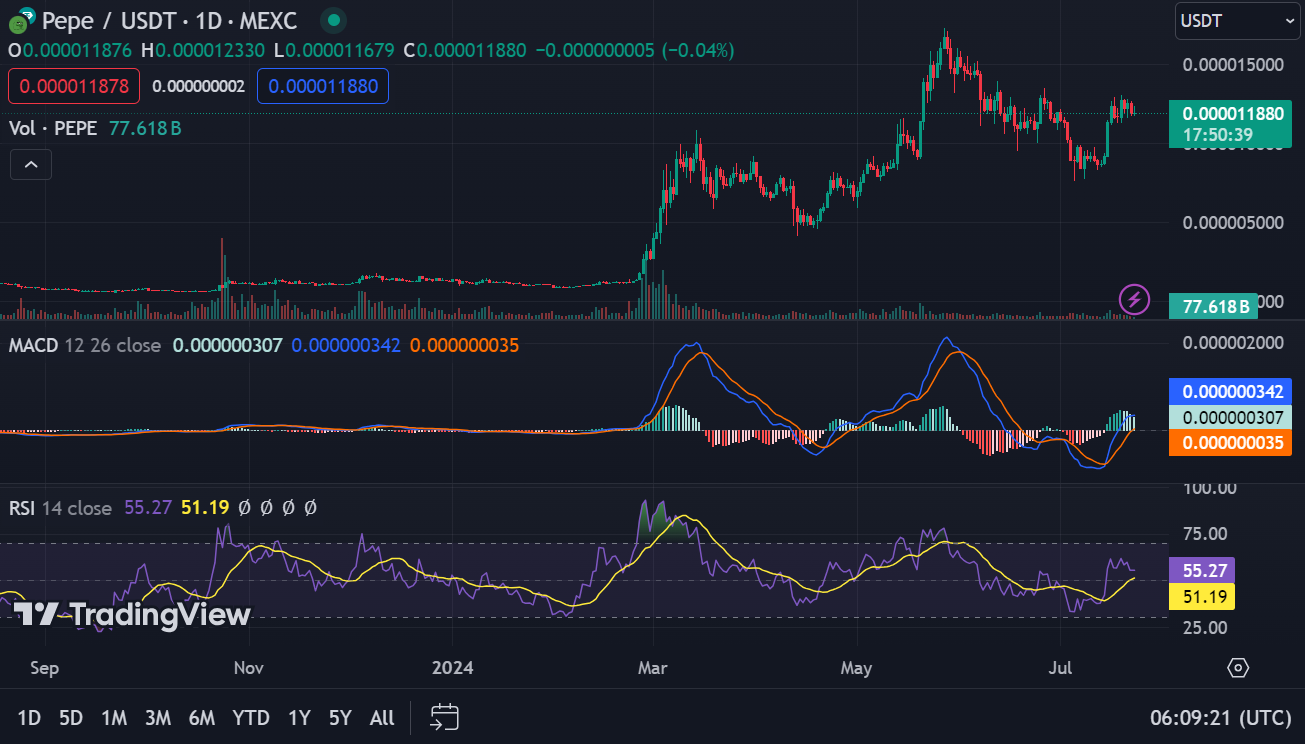
The 1-day RSI reading of 54.59 suggests that PEPE is neither in an overbought nor oversold condition, indicating potential for further movement. Additionally, the 1-day MACD is trading above the signal line, which implies some short-term bullish momentum.


