


- PEPE’s recent bounce from support suggests a potential bullish trend is forming, indicating possible upward momentum.
- Immediate resistance could limit PEPE’s rise, with higher resistance levels potentially challenging further gains.
- Short-term MACD hints at possible bearish trends, even as overall support bounce signals potential for future gains.
The recent movement of PEPE has captured the attention of traders, particularly following a notable fakeout below the daily support level. This temporary dip appeared to break the key support zone but has since reversed, with the price now stabilizing above this crucial level. Given this recent bounce and the surrounding technical indicators, there are signs that PEPE might be poised for an upward surge, as highlighted by CryptoJack’s analysis.
The PEPE/USDT daily chart reveals a compelling story of resilience. The price had tested the support level around $0.000000845 multiple times, demonstrating substantial buying interest at this price point. This support level has proven its significance by consistently holding firm, even when challenged. As the price bounced back from this support, it signaled a potential shift in market sentiment.
Moving forward, the price of PEPE is likely to encounter resistance at several key levels. The immediate resistance is anticipated around $0.000001500. If the price reaches this level, traders should be prepared for possible selling pressure. Additionally, a higher resistance point is projected at $0.000002000. This level corresponds with previous highs, which could act as a formidable barrier to further price increases.
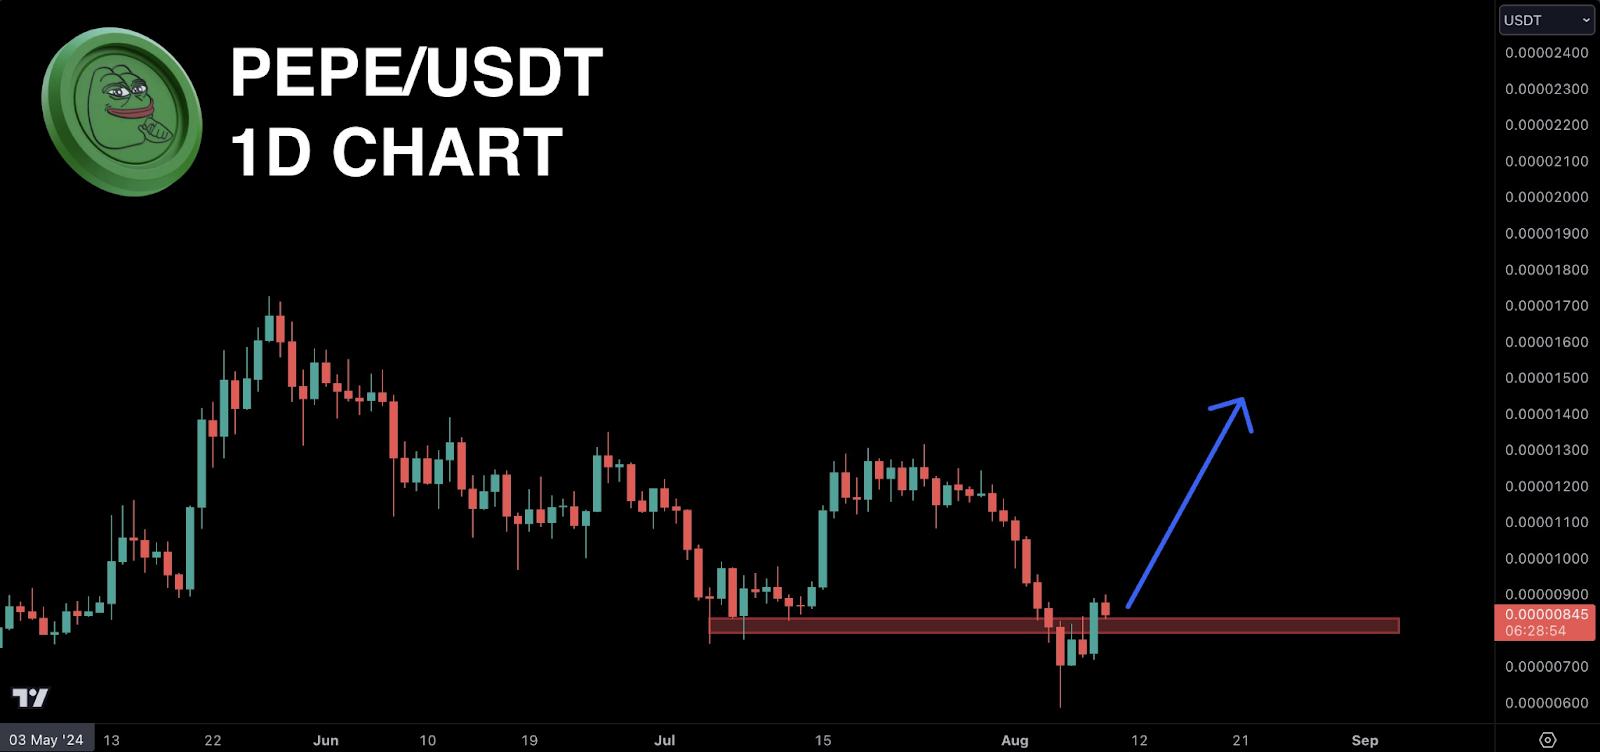
The current trend analysis suggests that PEPE might be transitioning from a downtrend to an upward movement. This shift is visually represented by the blue arrow on the chart, indicating a potential bullish trend. For a sustained upward movement, it is crucial that the price remains above the support level and successfully breaks through the immediate resistance.
PEPE and DOGE Display Bullish Signals, Analysts See ReversalsIn terms of the latest market data at press time, PEPE is trading at $0.000008 with a 24-hour trading volume of $756,426,752. Over the past 24 hours, the cryptocurrency has experienced a decline of 2.51%. This drop might be seen as a minor correction within a broader bullish framework.
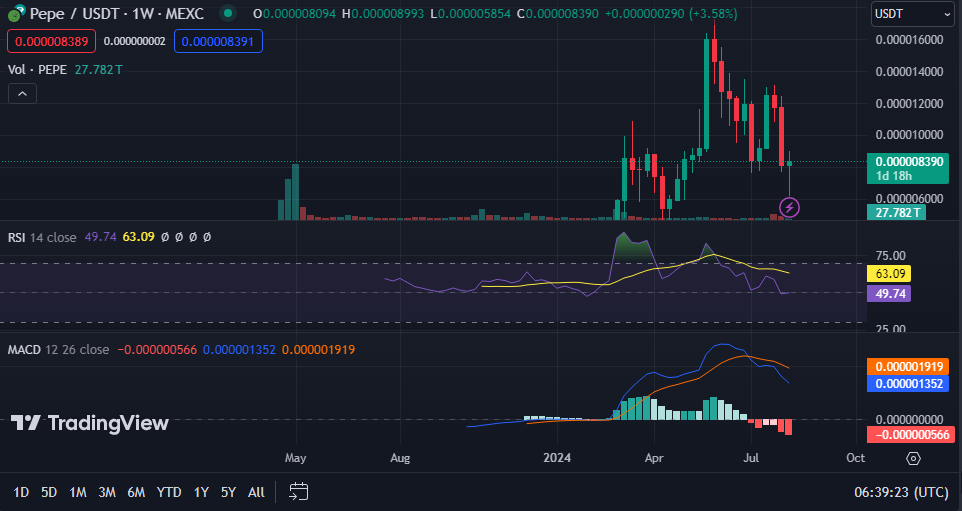
Additionally, the 1-week Relative Strength Index (RSI) stands at 49.74. This neutral reading suggests that PEPE is neither overbought nor oversold, remaining in a balanced state. However, the 1-week Moving Average Convergence Divergence (MACD) is trading below the signal line. This positioning hints at a potential bearish trend in the short term, which could impact the immediate price movement of PEPE.


