


- Pepe’s upward trajectory is fueled by strong liquidity and trading volumes, signaling sustained investor interest.
- Clear support and resistance levels provide key zones for traders to navigate amid bullish momentum.
- Monitoring indicators like RSI, MACD, and ADX is crucial to gauge short-term price movements and potential corrections.
Pepe (PEPE) has emerged as a formidable player in the crypto market, consistently hitting new all-time highs and attracting significant trading activity on platforms like Binance. The meme-inspired token has been on a steady upward trajectory, buoyed by strong liquidity and trading volumes. As at press time, Pepe’s price stands at $0.00001365, with a 24-hour trading volume surpassing $4.2 billion and a remarkable 23.66% surge within the last day.
The price movement analysis reveals a compelling narrative of bullish momentum coupled with periodic consolidation phases. As per analysis by Altcoin Sherpa, an analyst, a notable breakout around May 20 marked a significant turning point, with the price surging and trading volume spiking. Subsequent consolidation led to the formation of clear support and resistance levels, delineating key zones for traders to watch.
Primary support is observed around 0.00001100, a level previously tested as resistance before the breakout. This zone has proven pivotal during pullbacks, as evidenced by the price action and the green shaded area denoting its significance. Additionally, a secondary support zone at 0.00001200 further reinforces the bullish sentiment, providing a cushion for minor corrections.
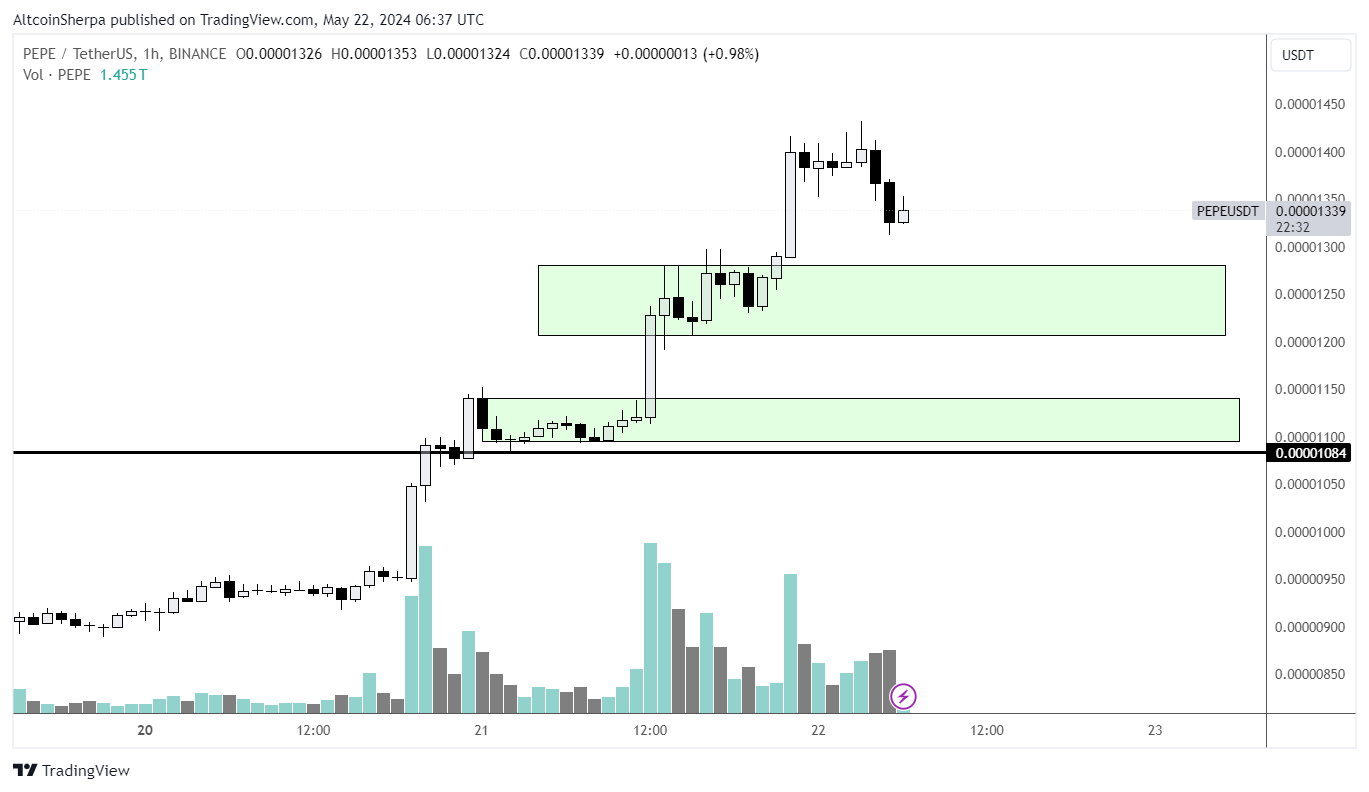
On the resistance front, 0.00001350 emerges as a formidable barrier, with multiple tests indicating substantial selling pressure. The reluctance of buyers to push the price beyond this level without consolidation underscores its significance in the current price dynamics.
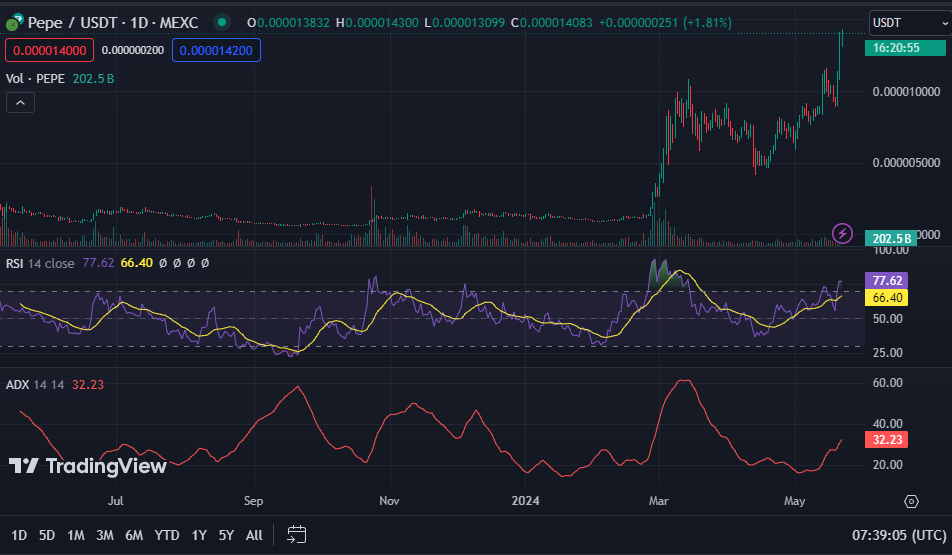
Volume analysis complements the price trend, with notable spikes during breakout periods and sustained activity during consolidation. Indicators like the 1-day RSI reading of 76.10 suggest a potential overbought scenario in the short term, while the MACD trading above the signal line hints at an imminent correction.
Despite this, the 1-day ADX reading of 32.22 indicates a strong trend, albeit with a cautionary note to monitor signs of momentum weakening as it approaches the overbought threshold.


